1. Crash safety data landscape
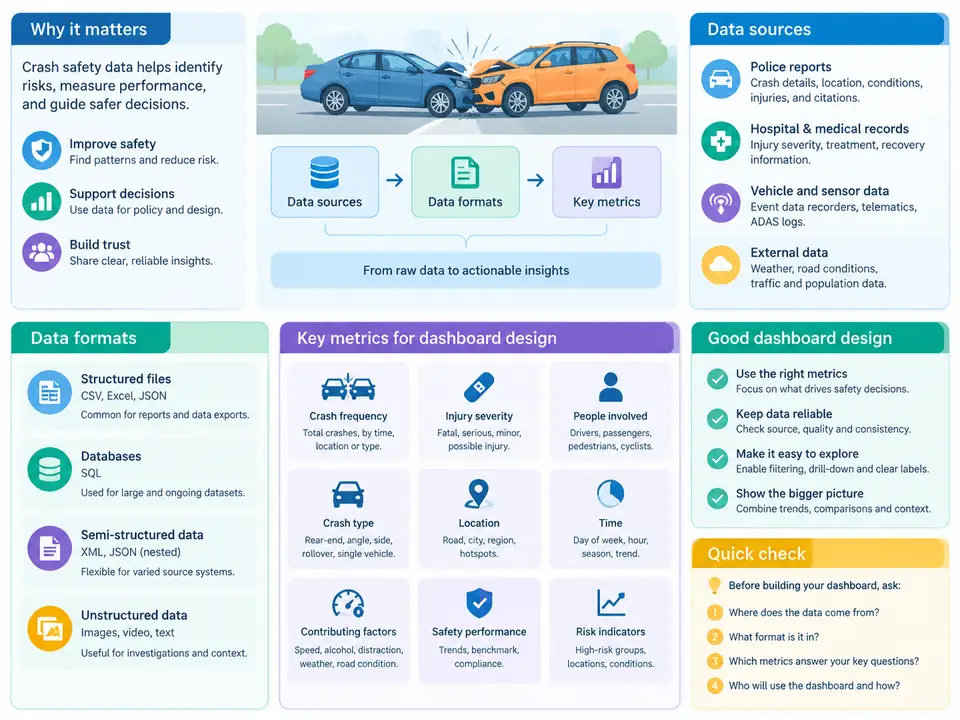
A crash safety dashboard is only as trustworthy as the data feeding it. Before a single visual is placed on the canvas, the designer must understand where crash data originates, how it is structured, what its limitations are, and which metrics genuinely reflect occupant protection performance. This chapter maps that landscape so that every later design decision — from table relationships to DAX measures to visual selection — rests on a clear understanding of the underlying data.
Where Crash Safety Data Comes From
Crash safety data typically arrives from several distinct source families, each with its own granularity, latency, and bias profile. The most common sources in a vehicle safety or fleet analytics context include:
- Event Data Recorders (EDRs) — onboard modules that capture pre-crash speed, brake/throttle input, steering angle, seatbelt status, and delta-v (Δv) during impact. EDR output is high-frequency, per-vehicle, and event-triggered, usually exported as CSV or parsed binary records.
- Collision repair and insurance claims systems — structured records of damage severity, repair cost, injury claims, and vehicle identification. These are transactional and relational, often delivered as database extracts or flat files.
- Crash test facilities — sled and full-vehicle barrier tests producing time-series channels (acceleration, force, displacement) alongside pass/fail criteria such as HIC, chest deflection, and femur load. Data arrives as CSV channel dumps or standardized test reports.
- Field incident and telematics feeds — connected-vehicle notifications, harsh-event triggers, and post-crash call-center logs. These are semi-structured JSON or API payloads with variable completeness.
- Regulatory and public datasets — national crash databases (for example, police-reported collision files) used for benchmarking and exposure normalization.
Each source answers a different question. EDR data tells you what the vehicle experienced; claims data tells you what it cost; test data tells you how the design performed under controlled conditions. A well-designed dashboard keeps these provenance boundaries visible rather than blending them into a single undifferentiated "crash count."
Formats and Structural Characteristics
The format mix matters because Power BI's modeling choices follow from it. Time-series channels from crash tests are tall, narrow tables (one row per timestamp per channel) and are best handled with a dedicated timestamp dimension. EDR event records are wide, one-row-per-event tables with dozens of sparse columns. Claims extracts are normalized across vehicle, incident, and party tables, requiring relationship design. Telematics JSON needs flattening in Power Query before it can participate in a star schema.
A practical rule: land raw data in a staging layer, preserve the original event identifier and source system name, and only then conform it into fact and dimension tables. The following snippet shows a minimal staging pattern that keeps provenance intact while normalizing a test-channel extract:
let
    Source = Csv.Document(File.Contents("crash_test_channels.csv"),
        [Delimiter=",", Columns=6, Encoding=65001]),
    Promoted = Table.PromoteHeaders(Source),
    Typed = Table.TransformColumnTypes(Promoted, {
        {"TestID", type text},
        {"Channel", type text},
        {"Time_ms", type number},
        {"Value", type number},
        {"Unit", type text},
        {"SourceSystem", type text}
    }),
    Filtered = Table.SelectRows(Typed, each [Time_ms] >= 0)
in
    Filtered
Note the explicit Unit and SourceSystem columns. Mixing g and m/s² or kN and N without a unit column is one of the most common causes of silently wrong dashboard aggregates.
Key Metrics That Belong on a Crash Safety Dashboard
Metric selection should follow the safety question being asked, not the availability of columns. The table below summarizes the core metrics, their definitions, and the design caveat each carries.
| Metric | Definition | Typical Source | Design Caveat |
|---|---|---|---|
| Delta-v (Δv) | Change in velocity during impact, km/h | EDR, test channels | Direction-dependent; state the axis convention |
| HIC15 / HIC36 | Head Injury Criterion over 15 ms / 36 ms window | Crash test accelerometers | Window length must be fixed and labeled |
| Chest deflection | Peak rib deflection, mm | Dummy instrumentation | Dummy type affects thresholds |
| Injury severity (MAIS) | Maximum Abbreviated Injury Scale, 0–6 | Claims, medical coding | Often missing; treat as sparse |
| Crash count / rate | Events per period or per million km | Telematics, fleet logs | Requires exposure denominator |
| Repair cost per event | Mean and median claim value | Claims system | Heavy right skew; show median |
| Seatbelt usage at impact | Belted/unbelted flag | EDR | Missing values are not "unbelted" |
Two conventions must be fixed before any visual is built. First, Δv sign and axis: define positive Δv as the longitudinal deceleration direction and state it in the dashboard's metric glossary. Second, severity banding: agree on thresholds (for example, low < 15 km/h, moderate 15–30 km/h, severe > 30 km/h) and encode them once as a dimension table so every visual uses identical bands.
From Source to Dashboard: The Data Flow
The diagram below shows how the source families converge into a conformed model and which metrics each contributes. It is deliberately a data-flow view rather than a process checklist, because the designer's main risk is losing provenance or double-counting events across sources.
Practical Data-Quality Checks Before Modeling
Before building relationships, run a short validation pass. These checks catch the defects that most often corrupt crash dashboards:
- Event uniqueness. Confirm that
EventIDis unique across the combined fact table. Duplicate events from overlapping telematics and claims feeds inflate crash counts. - Unit consistency. Group by
Unitand channel; any channel appearing with two units indicates a mixed extract that must be converted before aggregation. - Null versus zero. Count nulls in
BeltedandMAIS. If nulls exceed roughly 20%, exclude those fields from headline KPIs and surface completeness as a separate quality indicator. - Timestamp sanity. Verify that
Time_msstarts at or near zero per test and that no negative or duplicated timestamps exist. - Exposure denominator. Confirm that vehicle-kilometers or fleet-days are available for the same period as crash counts; without it, crash rate cannot be computed honestly.
Design Implications
The landscape described here directly shapes the dashboard architecture. Because sources differ in grain, the fact table must be defined at the event level and enriched with dimensions rather than merged at the source. Because units and severity bands vary, they must be conformed once and reused everywhere. Because several metrics are sparse or skewed, the dashboard should favor medians, distributions, and completeness indicators over simple averages. And because provenance matters for safety decisions, every visual should be traceable back to its source system — a requirement that begins with the staging pattern shown above and continues through every measure defined in later chapters.