1. Occupant restraint systems and crash res
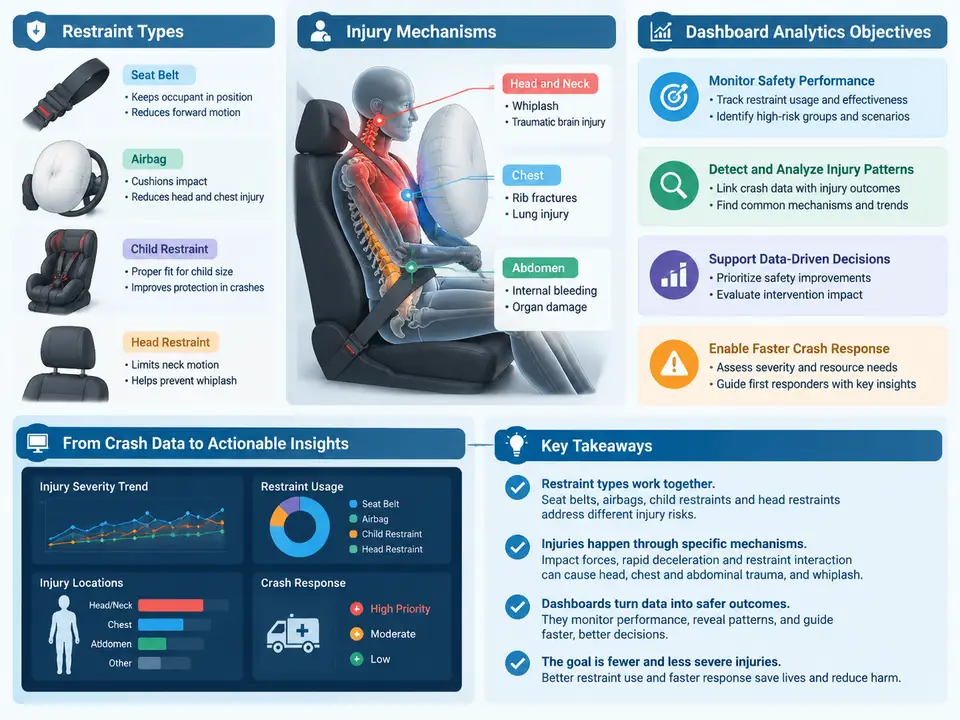
Occupant restraint injury analytics sits at the intersection of vehicle crashworthiness, biomechanics, and data engineering. Before any dashboard can be trusted, the analyst must understand what the restraint system is physically doing during a crash, how that loading translates into injury, and which analytical questions the dashboard is actually meant to answer. This chapter establishes that foundation: it classifies restraint hardware, traces the injury mechanisms each component is designed to mitigate, and defines the objectives that a crash response dashboard must satisfy to be useful in engineering and forensic work.
Restraint System Taxonomy
Restraint systems are conventionally divided into primary (energy-absorbing) and supplemental devices. The seat belt remains the primary restraint; airbags are supplemental and are calibrated to work with the belt, not instead of it. A practical taxonomy for analytics work groups components by the load path they create:
- Belt restraints: three-point lap-shoulder belts with retractor, pretensioner, and load limiter; lap-only belts in older or rear-center positions; four-point and belt-in-seat variants in performance or commercial vehicles.
- Frontal airbags: driver steering-wheel module, passenger instrument-panel module, knee bolster airbags, and out-of-position-sensitive variants.
- Side restraints: seat-mounted side thorax airbags, curtain airbags, and side pelvic airbags.
- Other inflatable devices: seat-belt airbags (inflatable belts), far-side airbags, and pedestrian-protection devices where relevant to the vehicle platform.
- Ancillary systems: seat-belt reminders, occupant classification sensors (OCS), buckle switches, and rollover sensors that gate deployment decisions.
Each component has a characteristic force-time signature. The retractor locks and spools out webbing under a controlled load-limiter force (commonly in the 3–6 kN range at the shoulder for a load-limited belt, though values vary by platform and regulation). The pretensioner fires within the first 10–20 ms to remove slack. The airbag inflates over roughly 20–50 ms and then vents, and its restraint effect depends heavily on occupant position, belt use, and the venting strategy. These timing relationships are the raw material of crash response analytics.
Injury Mechanisms and the Load Path
Injury in a crash results from energy transfer to the body exceeding tissue tolerance. The restraint system's job is to spread deceleration over time and area, and to redirect the occupant's kinematics so that the head, thorax, and pelvis are decelerated together rather than sequentially. The principal mechanisms an analyst must recognize are:
- Head and brain injury: linear acceleration causing diffuse axonal injury and contact injury from striking the steering wheel, A-pillar, or deploying airbag. Rotational acceleration is a major contributor and is not captured by simple HIC alone.
- Cervical spine injury: tension-compression and flexion-extension loading, particularly in rollover and far-side events.
- Thoracic injury: rib fracture and aortic injury from belt loading, steering-wheel contact, or airbag deployment force. Chest deflection and viscous criterion (VC) are the standard correlates.
- Abdominal injury: submarining under the lap belt, where the pelvis slides forward and the belt loads soft tissue instead of the iliac crest.
- Lower extremity injury: knee-thigh-hip loading against the knee bolster or instrument panel.
The critical insight for analytics is that belt use changes the injury mechanism, not just the injury severity. An unbelted occupant in a frontal crash typically loads the steering wheel or instrument panel directly, producing a different injury pattern than a belted occupant whose chest is loaded by the shoulder belt. A dashboard that reports only "injury severity" without conditioning on restraint state will conflate these populations and mislead the analyst.
From Physical Response to Dashboard Objectives
A crash response dashboard is not a generic BI report. Its objectives are specific and should be stated explicitly before any visualization is built:
- Characterize the crash population: distribution of delta-V, principal direction of force (PDOF), collision type, and restraint state across the dataset.
- Attribute injury to mechanism: link each injury (by AIS body region and severity) to the restraint component and loading path most plausibly responsible.
- Evaluate restraint effectiveness: compare injury outcomes for belted versus unbelted, airbag-deployed versus not, and pretensioner-fired versus not, while controlling for severity.
- Detect anomalies and outliers: flag cases where the restraint system underperformed, misfired, or where the occupant was out of position.
- Support countermeasure decisions: surface the combinations of crash parameters and restraint configurations associated with the highest injury burden, so engineering effort can be prioritized.
These objectives determine the data model. A dashboard built only on crash-level records (delta-V, PDOF, restraint flags) can satisfy objectives 1 and partially 3, but cannot satisfy objective 2 without occupant-level injury records linked by case ID. The analyst should confirm the join key and injury coding scheme (AIS 2005/2008 update, or ISO 12353-1 for collision deformation classification) before building any view.
Worked Example: A Minimal Crash Response Dataset
Consider a teaching dataset of 500 frontal collisions. Each record carries case_id, delta_v_kmh, pdoF_deg, belt_state (belted/unbelted), pretensioner_fired, airbag_deployed, occupant_age, and a linked injury table with ais_region and ais_severity. A first analytical pass computes the injury rate by restraint state within delta-V bands:
-- Example: injury rate (AIS 2+) by belt state and delta-V band
SELECT
  CASE
    WHEN delta_v_kmh < 20 THEN '0-19'
    WHEN delta_v_kmh < 40 THEN '20-39'
    WHEN delta_v_kmh < 60 THEN '40-59'
    ELSE '60+'
  END AS dv_band,
  belt_state,
  COUNT(DISTINCT case_id) AS cases,
  SUM(CASE WHEN ais_severity >= 2 THEN 1 ELSE 0 END) AS ais2plus,
  ROUND(100.0 * SUM(CASE WHEN ais_severity >= 2 THEN 1 ELSE 0 END)
        / COUNT(DISTINCT case_id), 1) AS ais2plus_rate_pct
FROM crashes
LEFT JOIN injuries USING (case_id)
GROUP BY dv_band, belt_state
ORDER BY dv_band, belt_state;
The expected output is a table of injury rates stratified by severity band and belt state. The analyst should verify that the denominator counts distinct cases, not injury rows, and that cases with no recorded injury are retained as zero-injury cases rather than dropped by the join. A common failure symptom is an inflated injury rate caused by an inner join that silently discards uninjured occupants; the fix is a left join from the crash table with a COALESCE on severity.
What the Dashboard Must Not Do
Three failure modes are common in early dashboard designs and should be designed out from the start. First, aggregation without stratification: a single "average injury severity" figure hides the bimodal distribution between belted and unbelted occupants and is analytically meaningless. Second, severity confounding: comparing restraint effectiveness without controlling for delta-V or PDOF will attribute crash severity differences to the restraint system. Third, silent data loss: joins that drop uninjured occupants, or filters that exclude cases with missing airbag flags, bias every downstream rate. Each of these is a data-model decision, not a visualization decision, and must be resolved before the first chart is drawn.
With the restraint taxonomy, injury mechanisms, and analytical objectives established, the analyst is positioned to design a dashboard whose views map directly onto engineering questions rather than onto whatever fields happen to be available. The remaining chapters build the data pipeline, the injury attribution logic, and the visualization layer on this foundation.