1. Multi-iteration CAE comparison and ranki
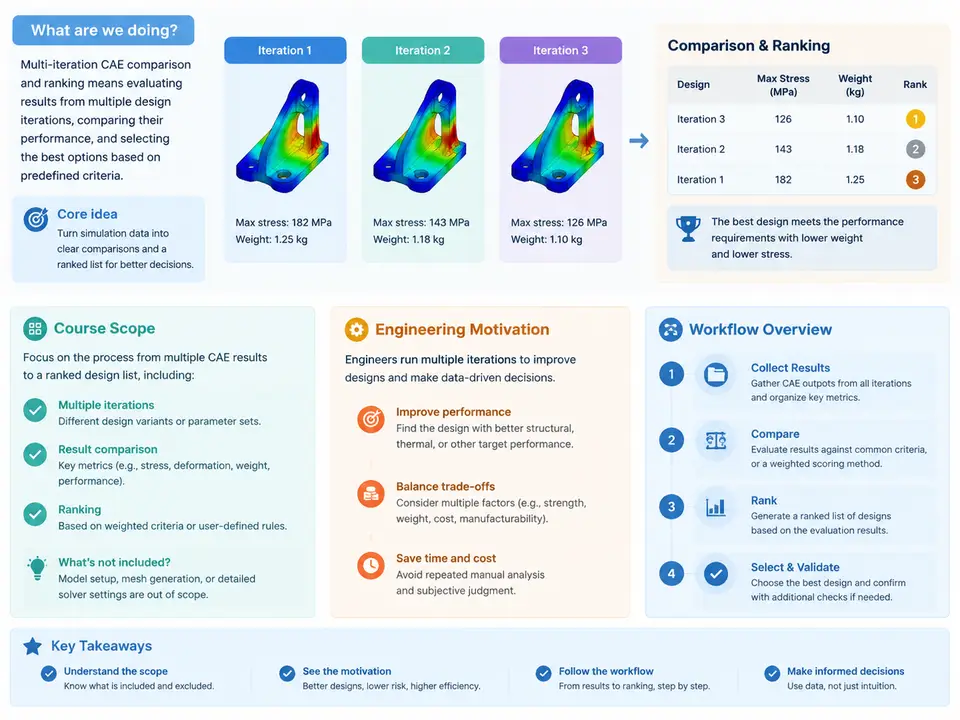
In a typical product development program, a single CAE run is rarely the end of the story. Design engineers submit an initial concept, simulation analysts return a set of results, the design is revised, and the cycle repeats — often dozens of times across a program. Each iteration produces its own model, its own load cases, and its own result files. The engineering question that eventually dominates the program is not "how did this one run perform?" but "across all the variants we have evaluated, which design is actually the best, and by how much?" This course addresses that question systematically: how to compare CAE results across multiple design iterations, how to rank candidate designs on defensible criteria, and how to communicate the ranking so that design decisions can be made with confidence.
What "multi-iteration comparison" actually means
Multi-iteration CAE comparison is the disciplined practice of placing results from two or more simulation iterations onto a common basis so that differences reflect design changes rather than modeling or post-processing inconsistencies. The word iteration here is deliberately broad. It may mean successive design revisions of the same part (thickness changes, rib layout, material substitution), parametric DOE runs where a solver is executed across a matrix of input values, topology or shape optimization loops, or even competing concepts from different teams. What unites them is that each iteration yields a result set that must be judged against the others.
Comparison is not the same as ranking. Comparison establishes what changed and by how much — a delta in mass, a shift in first natural frequency, a reduction in peak stress. Ranking imposes an ordering on those deltas according to weighted criteria and constraints. A program can compare results perfectly and still rank them badly if the criteria are poorly chosen or the weights are arbitrary. This course treats the two as distinct but coupled activities.
Why engineering programs need it
The engineering motivation is practical and, in most organizations, financial. Four drivers recur:
- Design space exploration. A DOE with 40 variants produces 40 result sets. Without a structured comparison and ranking method, the team gravitates toward whichever run someone happened to open last, or toward the variant with the most attractive single number — often at the cost of a constraint violation elsewhere.
- Traceability and auditability. Regulated industries and OEM-supplier relationships require evidence that the selected design was chosen on documented criteria, not preference. A ranking table with explicit metrics, weights, and normalization is that evidence.
- Trade-off visibility. Lightweighting almost always trades stiffness, strength, or NVH performance. Ranking exposes the trade-off surface so that the program can decide consciously rather than discover the penalty after prototype testing.
- Iteration cost control. When each solver run costs hours of HPC time, knowing early which variants are dominated (worse on every criterion) allows the team to terminate unpromising branches and redirect compute.
The workflow at a glance
The workflow this course develops has five stages. They are presented here as an overview; later chapters expand each into concrete procedure.
- Result set consolidation. Collect each iteration's output — model metadata, load case definitions, and scalar or field results — into a single structured dataset keyed by iteration ID. This stage is unglamorous and is where most comparison projects fail: mismatched units, inconsistent coordinate systems, or a changed boundary condition between iterations silently corrupt every downstream number.
- Comparability audit. Verify that the iterations are actually comparable. Same mesh density regime? Same material card revision? Same solver version and contact settings? Differences that are legitimate design changes are kept; differences that are modeling artifacts are corrected or flagged.
- Metric extraction and normalization. Reduce each iteration to a vector of decision metrics — for example mass, maximum von Mises stress, first bending frequency, and peak acceleration — and normalize them onto a common scale so that quantities with different units can be combined.
- Ranking. Apply weighting, constraint filtering, and a ranking rule (weighted sum, Pareto dominance, or a hybrid) to produce an ordered candidate list with the dominated designs identified.
- Reporting and decision record. Produce a comparison report that states the criteria, the weights and their justification, the ranking, and the sensitivity of the ranking to the weighting choice.
The single most important structural idea in this workflow is that the ranking is only as trustworthy as the comparability audit beneath it. A weighted-sum ranking built on results from two different mesh densities is not a ranking; it is a mesh-sensitivity study wearing a ranking's clothes. The course therefore spends disproportionate attention on stages 1 and 2.
Workflow structure and data flow
The diagram below shows how iteration result sets flow through consolidation and audit into a common comparison basis, then into metric extraction, ranking, and the decision record. Note the feedback path from the audit stage: when an iteration fails comparability, it is either corrected and re-entered or explicitly excluded with a documented reason — it does not silently proceed.
A worked illustration of the comparison basis problem
Consider a bracket program with five iterations. Iterations 01–03 use a second-order tetrahedral mesh with an average element size of 4 mm; iteration 04 switches to 3 mm to resolve a fillet; iteration 05 uses the same 3 mm mesh but a different material card revision. Suppose the extracted peak von Mises stresses are 182, 176, 171, 168, and 165 MPa respectively. A naive ranking would declare iteration 05 the best on strength. But the 4 mm to 3 mm mesh refinement alone can shift peak stress at a stress concentration by several percent, and the material card revision may change the yield allowable. The comparison basis is broken: the 165 MPa figure is not measuring the same thing as the 182 MPa figure.
The correct handling is to re-run iterations 01–03 on the 3 mm mesh (or, if compute budget forbids it, to document the mesh sensitivity and apply a conservative correction), and to confirm that the material card change in iteration 05 is an intended design variable rather than an accidental library update. Only then does the stress column become a legitimate ranking input. This example is illustrative; the specific numbers are hypothetical and are not results from an executed study.
Scope boundaries of this course
This course covers comparison and ranking of already-computed CAE results. It does not teach solver setup, meshing technique, or material calibration except where those directly affect comparability. It assumes results exist as scalar metrics (mass, peak stress, frequency, deflection, acceleration) and, where relevant, as fields for visual overlay. Optimization algorithms are discussed only as a source of iterations, not as the subject. The emphasis throughout is on the judgment layer between simulation output and design decision — the layer where most programs are weakest and where the largest gains in decision quality are available.
With the scope, motivation, and workflow established, the remaining chapters build each stage in detail: how to structure the consolidated dataset, how to run a comparability audit that catches the failure modes described above, how to choose and normalize metrics, how to select a ranking rule that matches the program's decision culture, and how to write a decision record that will survive review.