1. Course overview
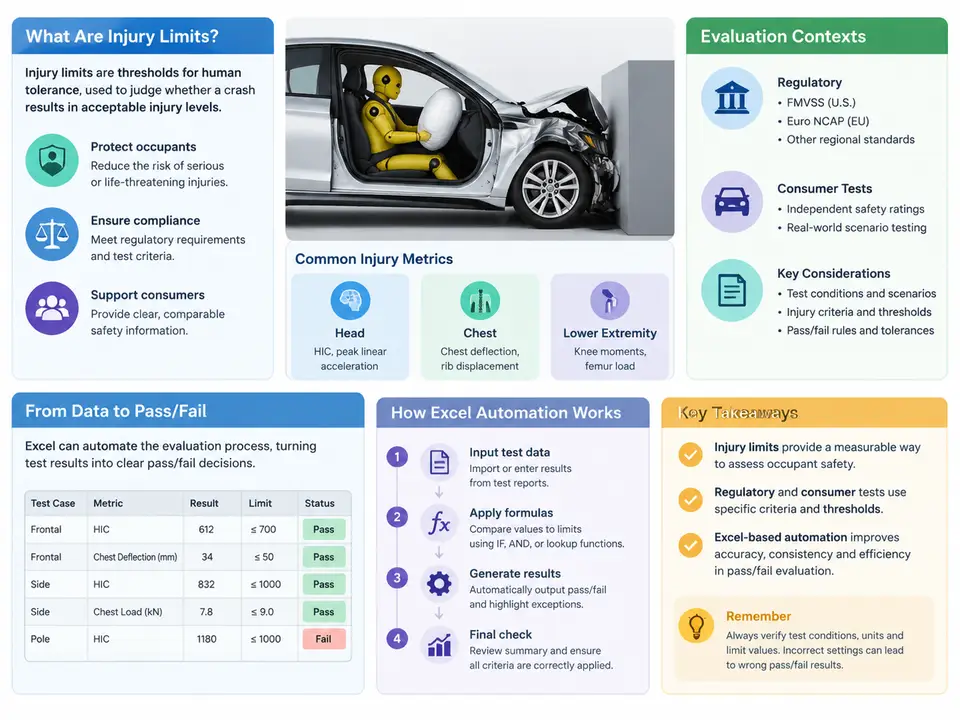
Automotive safety engineering is, at its core, a discipline of thresholds. Every crash test, every sled run, every component-level impact produces a stream of physical measurements — accelerations, forces, moments, displacements — and every one of those measurements must ultimately be compared against a limit. The question "is this occupant protected?" is answered, in practice, by asking a narrower and more mechanical question: does each injury metric stay below its permitted value? This chapter establishes the conceptual and regulatory landscape for that comparison, and explains why a spreadsheet-based automation layer is a legitimate engineering tool rather than a shortcut.
What Injury Criteria Actually Measure
Injury criteria are surrogate measures. They do not observe a human body directly; they observe the response of an anthropomorphic test device (ATD, commonly called a crash test dummy) or a finite element human body model, and map that response onto a probability of injury derived from biomechanical research. The mapping is statistical, population-based, and deliberately conservative.
Several criteria appear repeatedly across regulations and consumer programs, and it is worth fixing their definitions before any automation is designed:
- HIC (Head Injury Criterion) — computed from the resultant translational acceleration at the head CG over a 15 ms window, normalized by the acceleration of gravity. HIC15 and HIC36 differ only in the window length.
- 3 ms clip — the maximum resultant acceleration sustained for any cumulative 3 ms interval, typically applied to the chest or to the head in some regional regulations.
- Chest deflection and Viscous Criterion (VC) — deflection in millimetres, and the product of chest compression velocity and instantaneous compression, expressed in m/s.
- Nij and Nkm — normalized neck injury criteria combining axial force and bending moment, with direction-dependent intercepts.
- Femur force and tibia index — axial compressive load and a combined bending/axial index for the lower leg.
Each of these is a derived quantity. The raw channel is a time history sampled at 10 kHz or more; the criterion is the output of a filtering, windowing, and arithmetic pipeline. This distinction matters enormously for automation: the pass/fail decision is only as trustworthy as the derivation that precedes it.
Two Regulatory Cultures, One Comparison Problem
Automotive injury limits arrive through two distinct channels, and they behave differently in practice.
Homologation regulations — for example UN Regulation No. 94/95, FMVSS 208, or GB 11551 — define mandatory minimum performance. They specify the test configuration, the ATD, the channel list, the filter class (typically CFC 600 or CFC 1000 per SAE J211), and a single hard limit per criterion. A vehicle either complies or does not; there is no partial credit. The regulatory text is prescriptive about signal processing, which means the evaluation pipeline can be validated once and reused.
Consumer test programs — Euro NCAP, C-NCAP, IIHS, JNCAP — layer a scoring system on top of limits. A metric below a "high performance limit" earns full points; between the high and low limits, points are interpolated linearly; above the low limit, zero points and often a visual flag in the published result. The same physical measurement therefore produces not a boolean but a graded contribution to a star rating.
Both cultures share an identical computational skeleton: acquire channels, condition them, derive criteria, compare against a limit table, report. The difference lies in what happens after the comparison — a compliance statement or a score. An automation architecture that separates derivation from judgement handles both without duplication.
Where Manual Evaluation Breaks Down
A single frontal offset test can easily generate 40 to 80 channels across driver and passenger positions, each requiring filtering, criterion computation, and comparison against a limit that may depend on ATD type, seating position, belt configuration, and impact severity. Multiply by a vehicle program's test matrix — frontal, side, pole, rear, pedestrian, plus development iterations — and the arithmetic volume becomes the dominant error source, not the physics.
The characteristic failure modes of manual evaluation are well known and worth naming explicitly, because each one motivates a specific automation feature:
| Failure mode | Symptom | Automation countermeasure |
|---|---|---|
| Wrong limit applied | Pass reported for a configuration that should fail | Limit lookup keyed on ATD type, position, and test mode |
| Unit inconsistency | Deflection in mm compared against a limit in m | Explicit unit column and conversion at ingestion |
| Filter class mismatch | HIC differs by several percent from the reference tool | Fixed, documented CFC implementation with a verification case |
| Copy-paste drift | Formulas silently shifted between rows | Structured references and a single formula pattern |
| Stale results | Report reflects a previous channel export | Timestamp and source-file hash recorded per evaluation |
The Evaluation Chain, Visualized
The diagram below traces a single channel from acquisition to reported verdict, and shows where the limit table and scoring rule enter the chain. Note that the comparison stage is deliberately narrow: everything upstream is deterministic signal processing, everything downstream is presentation.
Why Excel, and What "Automation" Should Mean Here
Excel is not a simulation tool, and it should not be asked to filter a 10 kHz time history. Its legitimate role is the layer after derivation: ingesting a table of already-computed criterion values, applying the correct limit for each row, computing margins, and producing a verdict and a report-ready summary. In this role it offers three genuine advantages over bespoke scripts: the limit table is visible and auditable by non-programmers, the evaluation logic can be inspected cell by cell during a design review, and the output is immediately usable by the test engineer and the project manager without a toolchain installation.
Automation in this context means four concrete properties, not merely "using formulas":
- Deterministic lookup. The limit for a given row is retrieved by a key — ATD type, seating position, test mode, and criterion name — never typed by hand.
- Single formula pattern. One margin formula, filled down, so that a logic change is made in one place.
- Explicit failure surfacing. A row that fails must be visually and textually unmistakable, and a missing limit must produce an error state rather than a silent pass.
- Traceability. Each evaluation records its source file, timestamp, and the limit-table version used.
A Minimal Worked Example
Consider a driver-position frontal test with three criteria. The derived values arrive in a worksheet named Results; the limit table lives in Limits. A representative limit table might look like this (values are illustrative, not quoted from any regulation):
ATD_Type   Position   Test_Mode   Criterion   Limit   Unit
Hybrid III Driver     Frontal     HIC15       700     -
Hybrid III Driver     Frontal     Chest_3ms   60      g
Hybrid III Driver     Frontal     Femur_Fz    10      kN
The evaluation sheet then builds a composite key and retrieves the limit. Using structured references and XLOOKUP with a concatenated key:
=XLOOKUP(
   [@ATD_Type]&"|"&[@Position]&"|"&[@Test_Mode]&"|"&[@Criterion],
   Limits[Key],
   Limits[Limit],
   "NO LIMIT",
   0
)
The margin column is then simply =[@Limit]-[@Value], and the verdict column applies a threshold with an explicit guard for the missing-limit case:
=IF([@Limit]="NO LIMIT","CHECK",
   IF([@Margin]<0,"FAIL",
   IF([@Margin]<0.15*[@Limit],"MARGINAL","PASS")))
Two behaviours in this pattern deserve attention. First, the "NO LIMIT" fallback converts a silent zero — which would read as a catastrophic failure — into an actionable data-quality flag. Second, the MARGINAL band is an engineering convenience, not a regulatory category; it exists so that a criterion passing by 2% is not reported with the same confidence as one passing by 40%. Both behaviours should be documented in the workbook, because a reviewer will ask.
IF interprets as a pass. The most dangerous spreadsheet in a safety workflow is the one that reports PASS because a key was misspelled.Verification Before Trust
An automated pass/fail sheet is itself a measurement instrument and must be validated. A practical acceptance procedure is to take one previously evaluated test, enter its derived criterion values manually, and confirm that every verdict and margin matches the independently produced reference report to the displayed precision. Any discrepancy is traced to one of three places: the key construction, the limit table content, or the comparison logic. This single-case regression check, repeated whenever the limit table or formula pattern changes, catches the overwhelming majority of real defects — and it takes minutes rather than the hours a full manual re-evaluation would require.
With the evaluation chain, the two regulatory cultures, and the automation contract established, the remaining chapters build each stage in detail: constructing the limit table, implementing robust lookups, encoding criterion derivations, and generating reports that a reviewer can defend.