1. Framing virtual crash assessment claims
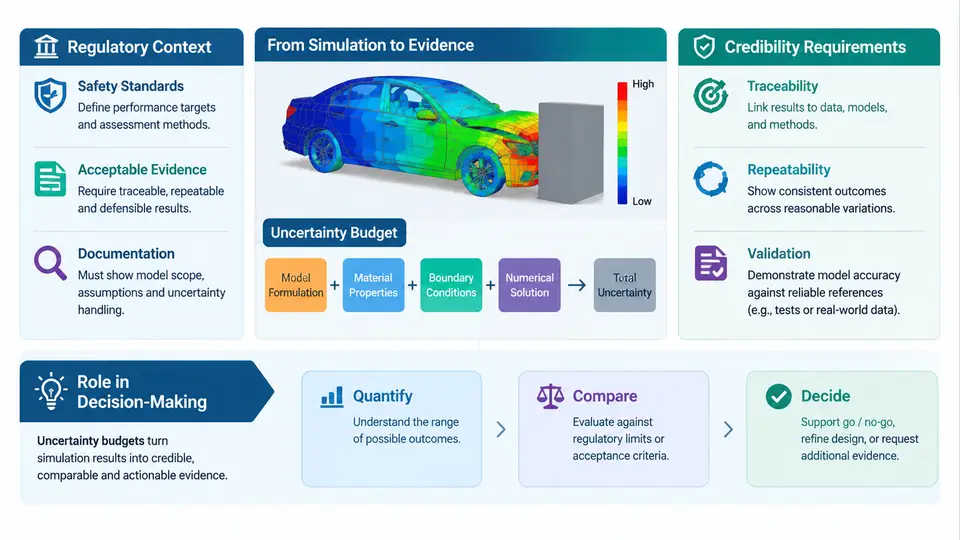
Virtual crash assessment is the practice of using numerical simulation — typically explicit finite element analysis of a vehicle structure, occupant restraint system, or roadside hardware — to support a safety claim that would otherwise require a physical test. The claim itself is the operative word. A simulation run is not evidence; it becomes evidence only when someone asserts a specific, bounded conclusion on the strength of it, such as "the occupant compartment intrusion at the driver footwell does not exceed 150 mm under the 64 km/h offset deformable barrier impact defined in the applicable regulation." That assertion, together with the model, the validation basis, and the quantified confidence attached to it, constitutes a virtual assessment claim.
The distinction matters because regulators, type-approval bodies, and internal engineering sign-off authorities do not accept simulation output at face value. They accept claims whose credibility has been demonstrated. An uncertainty budget is the instrument that makes that demonstration auditable: it enumerates every significant source of error and variability between the simulation and the physical reality it represents, quantifies each contribution, and combines them into a defensible statement of how much the predicted quantity could deviate from the true value.
Regulatory and standards context
There is no single global regulation titled "virtual crash assessment." Instead, credibility expectations arrive through several converging channels, and a competent claim must satisfy whichever ones apply to its intended use.
- Homologation and type approval. Regulations such as UN R94, R95, FMVSS 208, and FMVSS 214 prescribe physical test procedures. Where authorities permit simulation-supported evidence — for example in extension requests, variant coverage, or conformity-of-production arguments — the burden shifts to demonstrating that the model reproduces the regulated test conditions with known fidelity.
- Model credibility standards. ASME V&V 10 and 20, and the ASME V&V 40 series for medical devices, establish the vocabulary of verification, validation, and uncertainty quantification. NASA-STD-7009 and its companion handbook provide a credibility assessment scale that many automotive OEMs adapt internally. ISO 18571 defines objective correlation metrics for time-history signals such as acceleration pulses.
- Consumer and rating programmes. Euro NCAP and its counterparts increasingly accept simulation in support of variant grading, subject to documented model validation against reference tests.
- Internal design authority. Most OEMs maintain a simulation governance process that defines which crash load cases require physical correlation, what correlation threshold is acceptable, and who signs the claim.
The common thread is that the regulatory text rarely tells you how much uncertainty is tolerable. It tells you that the claim must be credible for its context of use. Translating that into a number is the engineer's job, and the uncertainty budget is where that translation is recorded.
What "credible" means operationally
Credibility is not a property of a model in the abstract; it is a property of a model for a specific intended use. A model validated for 50 km/h frontal barrier pulses may be entirely inadequate for a 32 km/h pole impact, even though both are frontal events. Three questions therefore frame every claim:
- What is the decision? A pass/fail judgement against a regulatory limit, a design-space exploration, a variant-coverage argument, or a trend study each demand different rigour. A trend study may tolerate 15% uncertainty in peak acceleration; a pass/fail judgement against a limit with only 5% margin cannot.
- What is the validation domain? The set of physical tests against which the model has been correlated, described by impact configuration, velocity, barrier or pole geometry, occupant size, and restraint configuration. Claims outside this domain require either new validation or an explicit, quantified extrapolation argument.
- How much margin exists? The gap between the predicted response and the acceptance threshold determines how much uncertainty the claim can absorb. A prediction of 140 mm intrusion against a 150 mm limit leaves 10 mm of margin; if the combined uncertainty is ±12 mm, the claim is not supportable without further evidence.
Where uncertainty enters a crash simulation
An uncertainty budget for a crash assessment typically draws from five families of contribution. The figure below maps them onto the path from physical reality to a signed claim, showing where each contribution enters and how they combine.
Each contribution is quantified in the units of the claimed quantity — millimetres of intrusion, g of acceleration, kilonewtons of belt force — and then combined. For independent contributions the root-sum-square is standard practice: uc = √(u₁² + u₂² + … + un²), with an expanded uncertainty U = k·uc at coverage factor k = 2 for roughly 95% confidence. Correlated contributions, such as mesh refinement and contact stiffness both influencing the same local deformation mode, must be handled with covariance terms or grouped into a single lumped contribution rather than double-counted.
A worked framing example
Consider a frontal offset claim on a body-in-white variant. The reference test at 64 km/h ODB produced 132 mm of footwell intrusion; the model predicts 140 mm. The acceptance threshold for the programme is 150 mm. The engineer assembles the budget as follows (values are illustrative, not measured):
| Source | Basis of estimate | Standard uncertainty (mm) |
|---|---|---|
| Test repeatability | Three repeat tests, standard deviation of peak intrusion | 3.0 |
| Mesh discretisation | Mesh convergence study, 8 mm vs 5 mm element size | 4.0 |
| Material parameter scatter | Gauge and strain-rate coupon variability, propagated | 3.5 |
| Restraint timing | Airbag trigger time tolerance ±2 ms | 2.5 |
| Numerical error | Hourglass energy < 5% of internal energy, mass scaling < 1% | 1.5 |
| Model form | Spot-weld failure idealisation, judged from prior correlations | 5.0 |
Root-sum-square gives uc ≈ 8.4 mm, and U = 2 × 8.4 ≈ 16.8 mm. The margin is 10 mm, which is smaller than the expanded uncertainty. The claim "intrusion remains below 150 mm" is therefore not supportable on the current evidence. The engineer has three legitimate responses: reduce the dominant contributions (the model-form term at 5.0 mm is the largest single item and warrants a targeted weld-failure correlation study), obtain additional physical evidence to tighten the test-repeatability and parameter terms, or reframe the claim as a comparative statement about the variant relative to the baseline, where common-mode errors partially cancel.
Why the budget, and not just a correlation score
A single correlation metric — a weighted ISO 18571 score of 0.82, say — tells you how well the model tracked a reference signal. It does not tell you how much a different predicted quantity, in a different configuration, might deviate. The uncertainty budget bridges that gap by decomposing fidelity into named, traceable contributions that can be re-evaluated when the load case, the variant, or the acceptance threshold changes. It is also the artefact that makes the claim reviewable: a reviewer can challenge a specific line item, ask for its basis, and see immediately how the combined uncertainty and the margin respond.
In evidence-based decision-making terms, the budget converts a simulation result into a statement of the form "the predicted value is 140 mm with an expanded uncertainty of ±17 mm at 95% confidence, for the validated domain spanning 50–64 km/h ODB impacts on this platform." That statement can be compared directly against a decision threshold, and the comparison — not the raw number — is what the sign-off authority evaluates. Framing the claim this way from the outset also shapes the validation programme: it identifies which contributions must be characterised before the claim can be made, rather than after it has been questioned.