1. Course overview
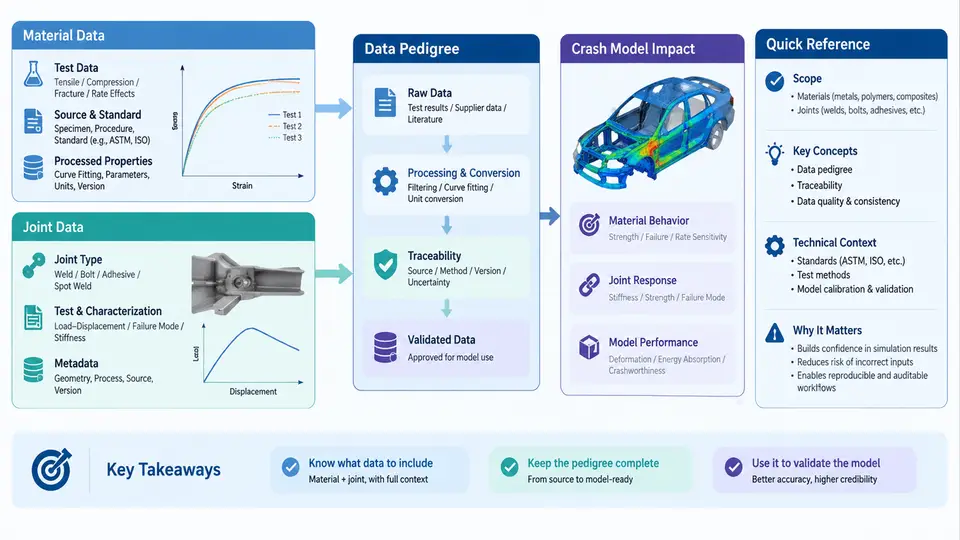
Crash simulation is only as trustworthy as the data that feeds it. A finite element (FE) crash model may converge cleanly, produce plausible animations, and still yield a deceleration pulse that is wrong by 15% because the steel grade in the material card was never verified, or because a spot weld was modeled as a rigid tie when the physical joint actually rotates and pulls out. Material and joint data pedigree is the discipline of recording, tracing, and qualifying the origin and processing history of every material property and joint characteristic used in a crash model, so that the credibility of simulation output can be defended with evidence rather than assertion.
This first chapter establishes the vocabulary, the scope boundary, and the engineering context for the remaining 29 chapters. It answers three questions: what a pedigree actually contains, why crash modeling demands it more than other CAE domains, and how pedigree evidence connects to formal credibility assessment frameworks.
What "Pedigree" Means in This Context
A pedigree is a documented lineage. For a material, it traces the property values in the solver deck back through the calibration process, the test campaign, the specimen extraction, the supplier heat or lot, and the governing specification. For a joint, it traces the connector definition back through coupon-level or component-level tests, the joining process parameters, and the manufacturing records. The output is not a single number but a chain of custody with quantified uncertainty at each link.
Four concept layers recur throughout the course and should be fixed now:
- Data item — the atomic value consumed by the solver: a flow stress curve, a strain-rate multiplier table, a failure strain, a weld nugget diameter, a spot-weld force–displacement response, an adhesive cohesive stiffness.
- Source class — where the value came from: measured on the actual production material, measured on a nominal equivalent, taken from a public database, inherited from a legacy model, or assumed by the analyst.
- Processing history — every transformation applied between measurement and solver input: filtering, smoothing, curve fitting, extrapolation beyond test range, unit conversion, temperature or rate interpolation, and reverse engineering from component tests.
- Uncertainty statement — the quantified or bounded confidence attached to the item, including test scatter, batch-to-batch variation, and calibration residual.
These layers matter because credibility arguments fail most often not at the solver but at the handoff between them. A material card with no source class is indistinguishable from a guess, no matter how well it reproduces a single validation test.
Why Crash Modeling Is a Special Case
Crash simulation differs from static stiffness or modal analysis in ways that amplify pedigree requirements:
- Large strain and strain rate. Properties are consumed far beyond the linear elastic regime, at rates from quasi-static to 10²–10³ s⁻¹. A pedigree that documents only the quasi-static curve is incomplete for crash use.
- Failure and fracture. Crash models depend on failure criteria — rupture strain, forming limit diagrams, cohesive parameters — that are highly sensitive to specimen geometry, mesh size, and calibration method. The pedigree must record the calibration route, not just the final value.
- Joints dominate the mechanism. In a body-in-white, thousands of spot welds, structural adhesives, and clinch or rivet connections govern load paths and energy absorption. Joint data pedigree is therefore not a secondary concern; it is often the largest single source of model uncertainty.
- Regulatory and safety consequence. Outputs feed occupant safety decisions, so traceability is a compliance expectation, not merely good practice.
Technical Context: Where Pedigree Sits in the Workflow
Pedigree is not a documentation task bolted on at the end. It is a data-flow property that must be captured as material and joint data move from test laboratory to correlation engineer to solver deck. The diagram below shows the principal flow and the points where pedigree evidence is created or lost.
The critical insight from this flow is asymmetry: pedigree evidence is cheap to capture at the source and expensive — sometimes impossible — to reconstruct later. Once a test report is archived without specimen lot linkage, or a calibration script is overwritten, the chain is broken. The course therefore treats pedigree as a capture-at-origin requirement rather than a retrospective audit.
Scope Boundary of This Course
The course covers metallic and polymeric materials used in crash-relevant structures, and the joint families that dominate body-in-white and battery-enclosure construction: resistance spot welds, structural adhesives, self-piercing rivets, clinches, and bolted connections. It addresses the data pipeline from specimen to solver card, the qualification criteria for accepting a data item, and the way pedigree evidence is consumed in credibility assessment.
Out of scope: detailed constitutive model theory, solver numerics, and manufacturing process design. These appear only where they affect data interpretation — for example, why a forming simulation's pre-strain must be recorded in the pedigree of a stamped component's material card.
Worked Example: A Pedigree Record in Practice
Consider a 590 MPa-class advanced high-strength steel used for a B-pillar. A minimal but defensible pedigree record for its solver card might look like this (values are illustrative, not measured):
material_id:  AHSS_590_BPILLAR_LOT_A17
source_class: measured_on_production_material
specimen:     ASTM E8 sheet tensile, 1.5 mm, rolling 0 deg
lot:          heat H-2291, coil C-04, supplier cert attached
test_rates:   0.001, 0.1, 10, 200 /s  (4 rates, 3 repeats each)
processing:   raw curves -> ISO 6892-1 filtering -> Voce fit
              -> rate extrapolation to 500 /s (flagged: extrapolated)
uncertainty:  yield +/- 3.2% (batch scatter), UTS +/- 2.1%
calibration:  component-level axial crush residual 4.8%
version:      v2.1, owner: materials engineering, 2024-11-08
Two entries carry most of the credibility weight. The source_class distinguishes this card from one built on handbook nominal values. The processing line explicitly flags the extrapolation to 500 s⁻¹ — a region where the model has no direct test support. An analyst reading this record knows immediately which part of the response is evidence-backed and which is inference. That distinction is exactly what a credibility assessment needs, and it is what a bare material card silently withholds.
How Pedigree Feeds Credibility Assessment
Formal credibility frameworks — such as ASME V&V 10 and 20, and the SAE J2740 family for crashworthiness — evaluate a model against three pillars: verification (are the equations solved correctly), validation (does the model match physical tests), and uncertainty quantification (how much of the gap is explained by input uncertainty). Pedigree is the backbone of the third pillar. Without it, validation margin cannot be decomposed into "model form error" versus "bad input data," and the analyst is left defending a correlation plot with no attribution.
In practice, pedigree evidence changes decisions. A model that over-predicts intrusion by 8% may be accepted if the pedigree shows the joint data came from production-representative coupons with 5% scatter and the calibration residual is documented. The same 8% gap becomes a blocking issue if the joint card was inherited from a legacy program with unknown provenance. The number is identical; the credibility is not.
What You Will Be Able to Do
By the end of the course, you should be able to construct a complete material and joint pedigree for a crash model, apply qualification criteria to decide whether a data item is fit for purpose, identify and repair broken pedigree chains, and present pedigree evidence in a form that supports a formal credibility argument. The chapters that follow build these capabilities in sequence: data sources and test methods, calibration and processing, joint characterization, uncertainty quantification, and finally the integration of pedigree into the credibility workflow.
The organizing principle throughout is simple and worth stating once: every number in a crash model has a history, and the model's credibility is bounded by the weakest link in that history. The work of this course is to make that history explicit, auditable, and defensible.