1. Frontal impact crash pulse fundamentals
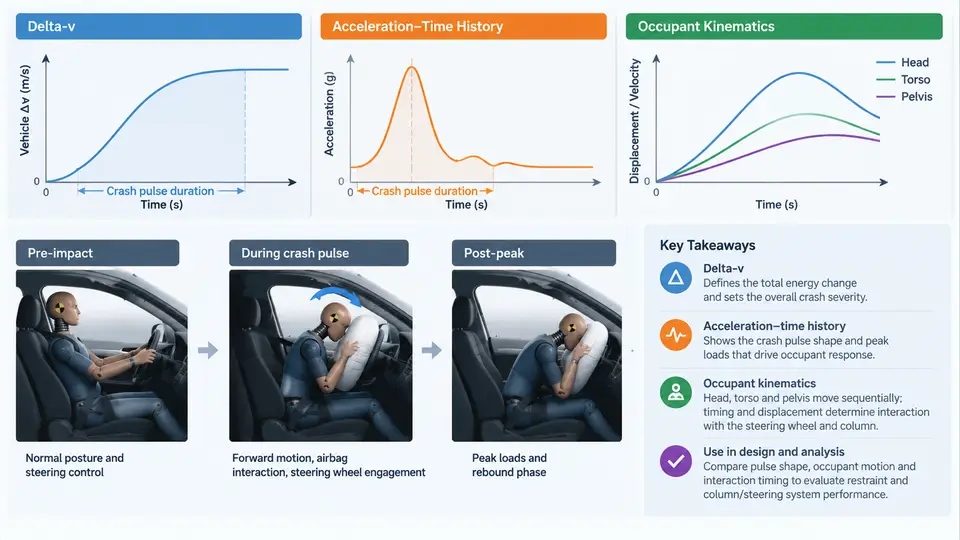
Every steering wheel and column interaction in a frontal crash is ultimately a story about relative motion. The vehicle decelerates; the occupant keeps moving forward; the steering wheel and column sit in the path between them. To reason about airbag timing, column collapse force, or wheel rim intrusion, you first need a working command of the crash pulse — the acceleration–time history that defines how the vehicle's velocity changes during the event — and of the occupant kinematics that pulse produces.
This chapter establishes the vocabulary and the physical picture that the rest of the course builds on. The goal is not to memorize numbers but to be able to look at a pulse, read it, and predict what the occupant and the steering system will do.
Delta-v: The Velocity Change That Matters
Delta-v (Δv) is the total change in velocity of the vehicle over the crash event, obtained by integrating the vehicle's longitudinal acceleration over time:
Δv = ∫ a(t) dt (over the crash duration)Two conventions must be fixed before any numbers are quoted. First, sign: in this course, the vehicle's forward direction of travel is positive, and the crash deceleration is therefore a negative acceleration. Delta-v magnitude is reported as a positive scalar (e.g., "Δv = 56 km/h"), while the acceleration trace is plotted negative. Second, the reference frame: all accelerations are measured in the vehicle frame (a body-mounted accelerometer at the B-pillar or tunnel), not in the inertial (ground) frame. Keeping these conventions consistent across pulse plots, occupant simulations, and test reports prevents the most common sign errors in sled and crash analysis.
Delta-v is the single most useful scalar for comparing crash severity, but it says nothing about how the velocity change was delivered. A 56 km/h delta-v delivered over 120 ms is a fundamentally different event from the same delta-v delivered over 60 ms. That difference is captured entirely by the acceleration–time history.
Reading the Acceleration–Time History
A frontal barrier pulse typically has three recognizable phases. The rise phase begins at bumper contact and climbs to a first peak as the front structure (bumper beam, crush cans, longitudinal rails) begins to crush. The plateau or secondary phase follows as the rails fold and the engine/transmission mass is engaged; this is where most of the delta-v is accumulated. The rebound phase occurs when the stored elastic energy pushes the vehicle back, producing a brief positive acceleration before the vehicle settles.
Three parameters dominate how that pulse is characterized:
- Peak acceleration — the maximum deceleration magnitude, typically 30–50 g at the B-pillar for a 56 km/h frontal barrier test, higher at the tunnel or engine mounts.
- Pulse duration — the time from first contact to the end of the significant deceleration, typically 80–130 ms for a full frontal barrier impact.
- Pulse shape — whether the trace is front-loaded (high early peak, rapid decay) or rear-loaded (gradual rise, late peak). Front-loaded pulses are harsher for the occupant because the occupant's relative velocity builds early, while the restraint system has had less time to engage.
The following diagram shows a representative 56 km/h frontal barrier pulse with its three phases, the integrated delta-v curve, and the corresponding occupant forward excursion relative to the vehicle interior.
Occupant Kinematics: The Relative Motion That Loads the Column
The vehicle pulse is only half the story. The occupant is not rigidly attached to the vehicle; the seat belt, seat, and friction couple the occupant to the vehicle with finite stiffness and slack. During the first 20–40 ms, the vehicle decelerates while the occupant's torso continues forward at nearly the original velocity. This relative velocity is what the restraint system must absorb.
For a belted occupant in a 56 km/h frontal impact, the sequence is broadly:
- 0–30 ms: Vehicle decelerates rapidly; occupant pelvis begins to load the seat and belt. The torso has barely moved relative to the vehicle.
- 30–70 ms: Belt force rises; the torso pitches forward and the head begins to translate forward and downward. The chest approaches the steering wheel.
- 70–120 ms: Peak forward excursion. This is the window in which the chest, and in some geometries the head or chin, can contact the steering wheel rim or the column-mounted airbag module.
- 120–180 ms: Rebound; the occupant is pulled back by the belt and the airbag deflates.
The critical insight for steering system design is that the occupant's forward excursion is not simply the integral of the vehicle delta-v. It is the difference between the occupant's motion and the vehicle's motion, filtered through belt stiffness, pretensioner firing, load limiter behavior, and airbag deployment. A stiffer belt and earlier pretensioner reduce excursion; a softer load limiter increases it. The steering column's collapse stroke must be sized against the residual excursion that remains after the restraint system has done its work.
Why the Pulse Shape Changes the Column Requirement
Consider two pulses with identical 56 km/h delta-v. Pulse A is front-loaded: it reaches −35 g at 25 ms and decays to −10 g by 80 ms. Pulse B is rear-loaded: it rises gradually to −25 g at 70 ms. In Pulse A, the occupant's relative velocity builds early, the belt engages while the occupant is still moving fast, and peak excursion occurs earlier and often larger. In Pulse B, the restraint system has more time to couple the occupant before the velocity difference peaks, and excursion is typically smaller.
For the steering column, this means the collapse force and stroke cannot be specified from delta-v alone. They must be evaluated against the specific pulse shape the vehicle delivers, because the column's job is to manage the residual occupant energy that reaches it after the belt and airbag have acted. A column tuned for a rear-loaded pulse may bottom out too early on a front-loaded pulse, producing a hard chest or head contact.
Practical Reading of a Pulse for Steering System Work
In practice, the engineer working on wheel and column interaction needs four numbers from the pulse and occupant data:
| Quantity | Typical range (56 km/h frontal barrier, illustrative) | Why it matters for the steering system |
|---|---|---|
| Delta-v | 50–60 km/h | Sets overall severity and the energy the restraint system must absorb |
| Peak B-pillar acceleration | 30–50 g | Indicates pulse harshness; front-loaded peaks raise occupant loading rate |
| Time to peak occupant excursion | 70–120 ms | Defines the window in which wheel/column contact can occur |
| Residual chest-to-wheel gap at peak excursion | Vehicle- and restraint-specific | Determines whether column collapse stroke is needed and how much |
These values are illustrative ranges for orientation, not measured results from a specific test. The actual numbers for a given vehicle come from barrier or sled testing and from occupant simulation correlated to that testing.
A useful sanity check when a pulse is presented without occupant data: integrate the acceleration trace to confirm the stated delta-v, and check that the pulse duration is consistent with the crush distance implied by the front structure. If the integrated delta-v does not match the reported value, the sign convention or the integration window is wrong — a common error when the rebound phase is included or excluded inconsistently.
What This Means for the Rest of the Course
The crash pulse defines the vehicle's velocity history; occupant kinematics define how the occupant moves relative to that history; and the steering wheel and column sit at the interface where the two meet. Every subsequent topic — column collapse force, wheel rim stiffness, airbag module geometry, and the interaction between the deploying airbag and the column — is a refinement of the relative-motion problem introduced here. With the pulse, the delta-v, and the excursion window clearly in mind, the design questions that follow become questions of timing, stroke, and force rather than abstract severity ratings.