1. MPDB test protocol fundamentals
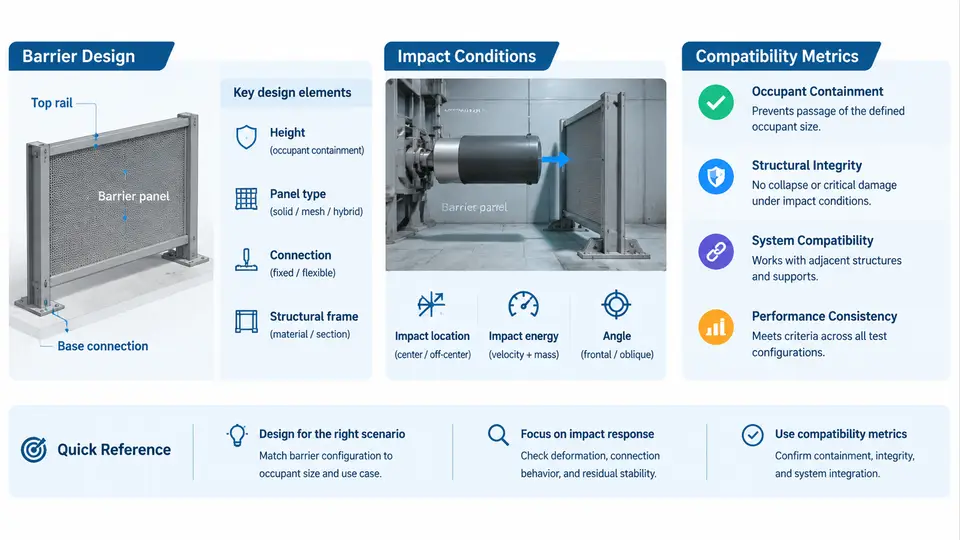
The Mobile Progressive Deformable Barrier (MPDB) test is the cornerstone of modern frontal crash compatibility assessment. Unlike a rigid or fixed-offset barrier, the MPDB introduces a moving, deformable counterpart that mimics the front end of a real opposing vehicle. This design choice transforms the test from a simple self-protection evaluation into a two-body compatibility problem: the subject vehicle must protect its own occupants while simultaneously managing the deformation it imposes on the barrier — a proxy for the harm it would inflict on a partner vehicle. Understanding the protocol fundamentals means understanding three interlocking elements: the barrier itself, the impact conditions that define the collision, and the metrics that translate physical outcomes into a compatibility score.
Barrier Design: The Deformable Counterpart
The MPDB barrier is a wheeled trolley carrying a deformable front structure. Its total mass is specified at 1400 kg ± 20 kg, representing a mid-size passenger car. The deformable element consists of two honeycomb blocks mounted on a rigid backing plate. The primary block, facing the subject vehicle, uses aluminium honeycomb with a specified crush strength, while a secondary block behind it provides progressive stiffening. The barrier's front face is 1400 mm wide and approximately 700 mm high, with the lower edge positioned to engage the subject vehicle's bumper and lower load path.
The critical design feature is the barrier's progressive crush characteristic. The honeycomb is engineered so that initial contact produces relatively low force, allowing the subject vehicle's front structure to engage before the barrier stiffens. This progressive behaviour is what makes the MPDB a compatibility tool rather than a pure energy-absorption test. A vehicle that concentrates its stiffness in a narrow central column will penetrate deeply into the barrier, generating high local forces and a poor compatibility outcome. A vehicle with a broader, more uniformly distributed front-end stiffness will engage the barrier across a wider area, distributing the load more evenly.
Impact Conditions: Geometry, Speed, and Overlap
The MPDB test is conducted at a closing speed of 50 km/h ± 1 km/h. The subject vehicle is driven forward while the barrier trolley moves in the opposite direction, or in some configurations the barrier is stationary and the vehicle impacts at the full closing speed. The standard overlap is 50% of the vehicle's width, measured from the vehicle centreline to the barrier centreline. This 50% overlap is deliberate: it creates a highly asymmetric loading condition that stresses the vehicle's ability to manage both self-protection and partner-protection simultaneously.
The impact geometry is defined in a fixed global coordinate system. The X-axis runs longitudinally along the vehicle's direction of travel, positive forward. The Y-axis runs laterally, positive to the vehicle's right. The Z-axis is vertical, positive upward. The barrier's centreline is offset by 50% of the vehicle width in the positive Y direction, meaning the barrier engages the vehicle's right-front quadrant. All deformation measurements and compatibility metrics are reported in this coordinate system, and any sign convention must be stated explicitly when interpreting results.
The ground-level alignment is equally important. The barrier's lower edge must engage the subject vehicle's bumper beam within a specified vertical tolerance. If the barrier rides too high, it may bypass the bumper and load the hood or grille — a configuration that produces unrealistic deformation patterns and invalidates the compatibility assessment. Conversely, if the barrier rides too low, it may underride the bumper entirely. Setup technicians verify this alignment using a laser height gauge before every test.
Compatibility Metrics: From Deformation to Score
The MPDB protocol produces two primary compatibility metrics, both derived from the barrier's measured response. The first is the Occupant Load Criterion (OLC), which characterises the severity of the deceleration pulse experienced by the subject vehicle's occupants. The OLC is computed from the vehicle's longitudinal acceleration-time history, filtered according to the protocol's specified channel frequency class. A higher OLC indicates a more severe pulse — meaning the vehicle's front structure absorbed energy too abruptly, transmitting high deceleration to the occupant compartment. The OLC is expressed in units of g and is normalised against a reference value derived from the barrier's response.
The second metric is the Standard Deviation (SD) of barrier face deformation. After the test, the barrier's honeycomb face is scanned or measured at a grid of points, and the deformation depth at each point is recorded. The standard deviation of these depths quantifies how unevenly the subject vehicle loaded the barrier. A low SD means the vehicle engaged the barrier broadly and uniformly — a good compatibility outcome. A high SD means the vehicle concentrated its load in a narrow region, leaving other areas of the barrier relatively undeformed. This concentration is precisely the mechanism by which stiff, narrow front ends cause harm to partner vehicles in real-world collisions.
Both metrics are combined into a single compatibility score. The exact weighting and normalisation are defined in the protocol document, but the principle is straightforward: the score penalises vehicles that produce high occupant loads and uneven barrier deformation. In practice, engineers use the individual metrics — not just the composite score — to diagnose specific design issues. A high OLC with a low SD suggests a vehicle that distributes load well but absorbs energy too abruptly. A low OLC with a high SD suggests a vehicle that is gentle on its own occupants but aggressive toward the barrier. The ideal design achieves both low OLC and low SD.
Practical Setup and Verification
Before a test, the barrier's honeycomb face must be inspected for damage or pre-crush. Any indentation deeper than the protocol's tolerance requires replacement of the affected block. The trolley's mass is verified on a calibrated scale, and the barrier's vertical alignment relative to the subject vehicle's bumper is checked with a laser height gauge. The subject vehicle is positioned so that the barrier's centreline aligns with the 50% overlap point, and the vehicle's tyre pressures and fluid levels are set to the manufacturer's specified values.
During the test, high-speed cameras record the impact from multiple angles, and the barrier's onboard accelerometers and load cells capture the force–displacement history. After the test, the barrier face is measured using a structured-light scanner or a manual depth gauge at a defined grid. The resulting deformation map is processed to compute the SD, while the vehicle's acceleration data is filtered and integrated to compute the OLC. Both values are then entered into the scoring algorithm.
Interpreting Results and Typical Failure Modes
A vehicle that performs poorly on the MPDB typically exhibits one of two patterns. The first is over-concentration: the front structure is stiff in a narrow central or offset region, causing deep local penetration into the barrier and a high SD. This pattern is common in vehicles designed primarily for rigid-barrier tests, where a strong central load path is advantageous but compatibility is neglected. The second is excessive deceleration: the front structure absorbs energy too quickly, producing a high OLC even if the barrier deformation is relatively uniform. This pattern often appears in heavier vehicles with short crush zones.
Remediation typically involves broadening the front-end load path — adding or strengthening structures that engage the barrier outside the primary impact zone — and tuning the crush characteristics to produce a more gradual deceleration pulse. In practice, engineers iterate between CAE simulation and physical testing, using the OLC and SD metrics as the primary feedback signals. The MPDB protocol thus provides not just a pass/fail verdict but a diagnostic framework for improving real-world compatibility.
| Metric | What It Measures | Desired Direction | Typical Diagnostic Use |
|---|---|---|---|
| OLC | Severity of occupant deceleration pulse | Lower is better | Identifies abrupt energy absorption / short crush zone |
| SD of barrier deformation | Uniformity of load distribution on barrier face | Lower is better | Identifies concentrated stiffness / narrow load path |
| Composite compatibility score | Combined normalised rating | Higher is better | Overall ranking and regulatory compliance |
The MPDB protocol's strength lies in its dual focus: it does not allow a vehicle to achieve a good score by protecting its own occupants at the expense of the partner vehicle, nor by being gentle on the barrier while subjecting its occupants to harsh deceleration. The barrier design, the 50% overlap geometry, and the paired OLC/SD metrics together create a balanced assessment framework that reflects the real-world requirement for frontal crash compatibility.