1. CAE cluster architecture and operational
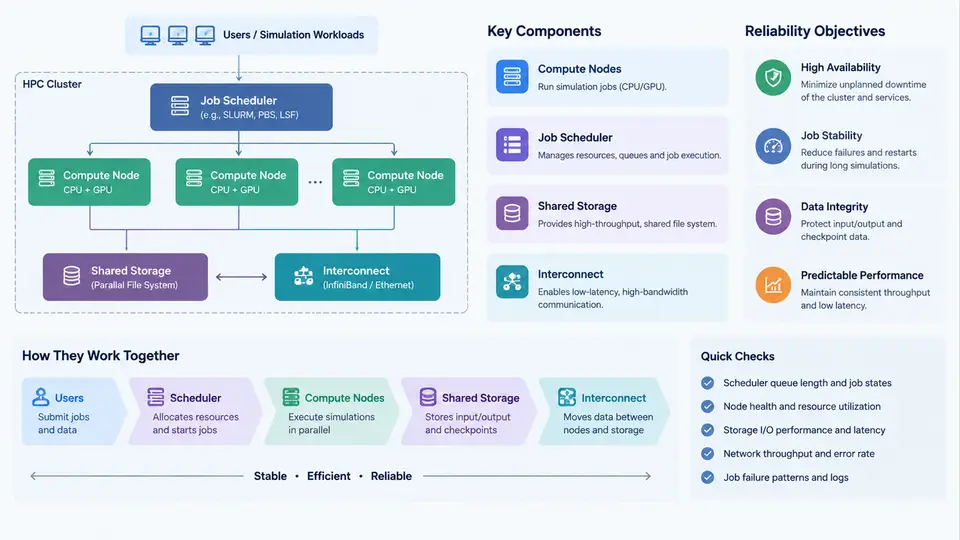
CAE simulation workloads—structural nonlinear analysis, CFD transient runs, explicit crash models, and design-of-experiments sweeps—differ fundamentally from web services or batch ETL jobs. They are long-running, tightly coupled, memory-bandwidth-hungry, and checkpoint-sensitive. A cluster that runs them well is not simply "a lot of CPUs"; it is a layered system whose reliability objectives are derived from the physics and the solver behavior. This chapter establishes the architectural vocabulary and the reliability targets that the remaining chapters will instrument, monitor, and operate against.
The Five Functional Planes of an HPC Cluster
It is useful to decompose a CAE cluster into five planes, each with distinct failure modes and distinct monitoring signals:
- Compute plane — login nodes, batch compute nodes, and often GPU nodes. Key attributes: core count, memory per core, local NVMe scratch, NUMA topology, and CPU frequency behavior under AVX-512 or similar vector loads.
- Scheduling plane — the job scheduler and its resource manager (Slurm, PBS Pro, LSF, or SGE). It owns queues, partitions, fair-share, backfill, and job lifecycle state.
- Storage plane — a parallel filesystem (Lustre, GPFS/Spectrum Scale, BeeGFS, or WekaFS) plus a home/metadata tier. CAE solvers are extremely sensitive to metadata latency and small-block random I/O during solver startup and result assembly.
- Interconnect plane — InfiniBand (HDR/NDR) or RoCEv2 Ethernet, with MPI collectives dominating communication. Fabric congestion and link flap are the classic silent killers of scaling efficiency.
- Management plane — provisioning (xCAT, Warewulf), configuration management, telemetry collection (Prometheus, Telegraf, IPMI/Redfish exporters), and the monitoring stack itself.
These planes are not independent. A metadata storm on the storage plane can stall MPI ranks, which the scheduler interprets as a hung job, which triggers a node drain—an availability event that originated three layers away from where it was observed.
Job Schedulers: The Control Loop of the Cluster
The scheduler is where reliability becomes visible to users. In Slurm, a job moves through a well-defined state machine: PENDING → RUNNING → COMPLETING → COMPLETED, with FAILED, TIMEOUT, NODE_FAIL, and OUT_OF_MEMORY as terminal failure states. Each transition is a monitoring opportunity. A rising NODE_FAIL count is not a scheduler bug; it is a hardware or fabric symptom surfacing through the scheduler's health-check interface.
For CAE specifically, two scheduler behaviors matter most. First, backfill allows short jobs to leapfrog long ones, which improves utilization but can starve a 72-hour CFD run if the partition is not tuned. Second, job preemption and requeue must be paired with solver checkpointing; a requeued job that restarts from zero wastes the entire allocation. The reliability objective here is not "never fail" but "fail and recover within a bounded, predictable cost."
Shared Storage: Where CAE Jobs Actually Stall
CAE solvers exhibit a distinctive I/O signature. During startup, they read a large mesh file (often 10–100 GB) with many small metadata operations. During the solve, they write checkpoint files at intervals. During post-processing, they write large result files. A parallel filesystem must handle all three patterns without letting one starve the others.
Consider a representative example: a 40-million-cell CFD case on 256 cores. The mesh read at startup may issue hundreds of thousands of stat() and open() calls. If metadata latency p99 exceeds roughly 5 ms, startup alone can consume 20–30 minutes of a 4-hour allocation. This is why metadata server (MDT) latency, not raw bandwidth, is often the first storage SLI to alert on.
Interconnect: The Silent Scaling Killer
MPI communication in CAE is dominated by MPI_Allreduce and MPI_Alltoall collectives. A single degraded link or a misconfigured adaptive routing table can reduce scaling efficiency from 85% to 40% without any job failing. This is the most insidious reliability problem in HPC: the cluster is "up," jobs complete, but throughput silently collapses.
Monitoring must therefore include fabric-level counters: symbol errors, link down events, and port-level throughput. Tools such as perfquery and ibdiagnet expose these. A useful SLI is effective collective bandwidth per job, derived from job runtime and message size, compared against a baseline for the same job on a known-good partition.
Reliability Objectives for Simulation Workloads
Generic IT SLIs (uptime, CPU utilization) are insufficient for CAE. The following table maps workload characteristics to concrete reliability objectives and the signals that verify them.
| Workload Characteristic | Reliability Objective | Primary Signal |
|---|---|---|
| Long-running jobs (hours to days) | Job success rate ≥ 99%; bounded restart cost | Slurm job state transitions; checkpoint age |
| Metadata-heavy startup | MDT p99 latency < 5 ms | Lustre/GPFS metadata RPC latency |
| Tightly coupled MPI | Scaling efficiency ≥ 80% of baseline | Collective bandwidth; fabric error counters |
| Checkpoint-sensitive | Checkpoint interval ≤ MTBF / 3 | Node MTBF; checkpoint write duration |
| Shared scheduler | Scheduler availability ≥ 99.9% | slurmctld heartbeat; job submission latency |
From Architecture to Observability
The architectural model above directly determines what you monitor. Each plane contributes a small set of high-value signals: node-level health and memory pressure from the compute plane; job state distribution and queue wait time from the scheduling plane; metadata latency and OST throughput from the storage plane; link errors and collective bandwidth from the interconnect plane; and scrape health and alert delivery from the management plane. When a CAE job fails or slows, the diagnostic path is to walk these planes in order—scheduler state first, then node health, then storage latency, then fabric counters—rather than guessing.
The next chapters will build the monitoring stack that collects these signals, define the dashboards that make them legible, and establish the operational procedures that turn raw telemetry into reliable simulation throughput.