3. Instrumentation and logging
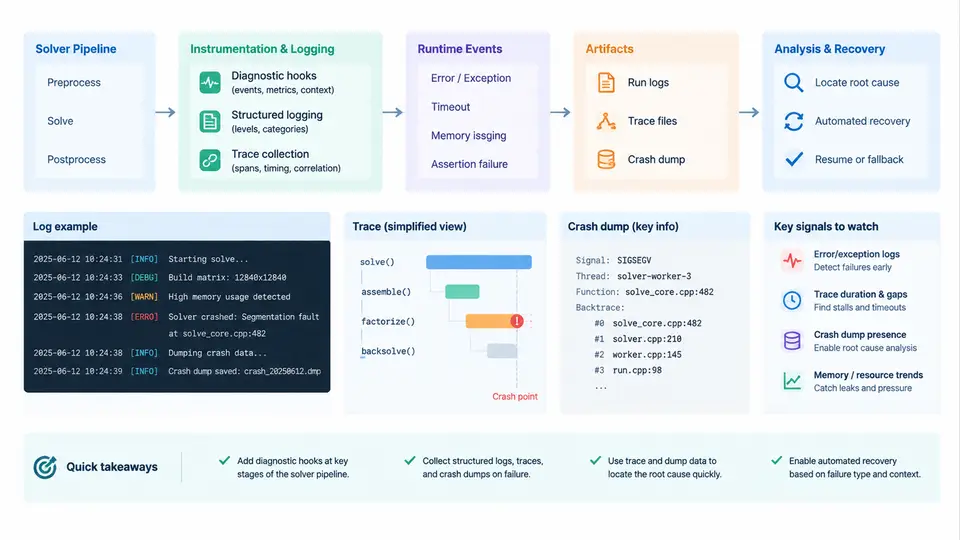
A crash solver is only as useful as the evidence it leaves behind. When a nonlinear solve diverges at iteration 4,000, or a linear solver returns a residual that silently violates its tolerance, the difference between a five-minute fix and a five-day investigation is almost always determined by what the pipeline recorded before the failure. This chapter treats instrumentation not as an afterthought bolted onto a working solver, but as a first-class subsystem designed alongside the numerical core.
Three Layers of Observability
Effective solver diagnostics are organized into three cooperating layers, each with a different cost profile and retention policy:
- Structured logging — low-cost, always-on records of discrete events: iteration counts, residual norms, step sizes, line-search outcomes, and configuration snapshots. These are cheap enough to emit every iteration.
- Trace collection — higher-fidelity, usually sampled or gated, capturing per-iteration vectors, Jacobian statistics, and timing spans. Traces answer "what was the state at the moment of failure?"
- Crash dumps — heavyweight artifacts generated only on abnormal termination: full memory images, thread stacks, and the complete solver state serialized to disk for offline replay.
The design principle is graduated cost: pay almost nothing during healthy operation, pay moderately when anomalies appear, and pay heavily only when the process is already dying.
Structured Logging in the Solver Loop
Unstructured printf debugging collapses under concurrency and makes automated triage impossible. Instead, emit machine-parseable records. A practical pattern is a single log line per iteration in a stable key-value format:
iter=4127 phase=newton residual_l2=3.81e-04 residual_inf=9.02e-05
  step_norm=1.44e-02 alpha=0.500 ls_iters=3 jac_cond=2.7e+08
  elapsed_ms=18.4 mem_rss_mb=2048 status=CONVERGING
Two fields deserve emphasis. jac_cond (the estimated condition number of the Jacobian) is an early-warning signal: a condition number climbing past 1e10 typically precedes stagnation by dozens of iterations. alpha (the accepted line-search step) collapsing toward zero while the residual stays flat is the classic signature of a solver trapped near a non-smooth region. Logging these two values every iteration turns a post-mortem into a trend analysis.
write() syscall sit inside the hot numerical loop — on a shared filesystem this alone can dominate runtime.Trace Collection: Sampling and Gating
Full per-iteration traces of large state vectors are prohibitively expensive, so collection is governed by a policy. Three common strategies:
| Strategy | Trigger | Typical Use |
|---|---|---|
| Periodic sampling | Every N iterations | Baseline performance profiling |
| Threshold gating | Residual stagnation or condition number spike | Capturing the onset of trouble |
| Ring buffer | Always on, fixed capacity | Retaining the last K iterations before a crash |
The ring buffer is the workhorse. Keep the last, say, 200 iteration snapshots in a preallocated circular buffer. When the solver aborts, flush the buffer to disk. This gives you the critical window leading up to the failure without the cost of writing every iteration. A snapshot need not include the full state vector — record the residual norm, step norm, active constraint set, and a hash of the state so you can detect when the state stops changing meaningfully.
Crash Dump Generation
When the solver hits a fatal condition — a NaN residual, a singular Jacobian that cannot be regularized, or an out-of-memory event — the pipeline should generate a crash dump before the process exits. On POSIX systems, install a signal handler for SIGSEGV, SIGABRT, and SIGFPE that writes a dump and then re-raises the signal so the OS still produces a core file.
void crash_handler(int sig) {
    dump_solver_state("/var/dumps/solver_%d.bin", sig);
    flush_ring_buffer();
    signal(sig, SIG_DFL);
    raise(sig);   // let the OS generate the core
}
The dump should contain, at minimum: the full configuration, the current iterate, the residual vector, the Jacobian (or its sparsity pattern plus values), and the last K log records. Serialize with a versioned header so that a dump from an older build can still be parsed by a newer analysis tool. A compact binary format with a JSON manifest is a good compromise — the manifest is human-readable, the payload is fast to write.
write().Wiring It Into the Pipeline
The diagram below shows how the three layers attach to a typical Newton–Krylov solver pipeline. Note that logging and tracing observe the iteration loop without modifying it, while the crash dump is triggered by the abort path and drains the ring buffer.
Practical Configuration Example
A concrete instrumentation configuration for a production solver might look like this. The values are illustrative and should be tuned to your problem size and I/O budget:
instrumentation:
  logging:
    level: info
    format: keyvalue
    sink: channel        # drained by writer thread
    fields: [iter, residual_l2, residual_inf, step_norm,
             alpha, ls_iters, jac_cond, elapsed_ms, status]
  trace:
    ring_capacity: 200
    gate:
      jac_cond_threshold: 1.0e10
      residual_stagnation_iters: 50
    snapshot_fields: [residual, step, active_set_hash]
  crash_dump:
    dir: /var/dumps
    include_jacobian: true
    manifest: json
    max_size_mb: 512
With this in place, a typical triage workflow becomes: the solver aborts, the crash handler writes a dump and drains the ring buffer, and the analysis tool loads the manifest to reconstruct the last 200 iterations. You can then plot jac_cond against iteration and see exactly when the Jacobian began to degrade — often hundreds of iterations before the visible failure.
Verification and Failure Symptoms
Instrumentation itself must be tested. Inject a synthetic NaN into the residual at a known iteration and confirm that the crash dump is written, the ring buffer is drained, and the manifest parses. A common failure mode is a crash handler that deadlocks because it tries to acquire a mutex held by the thread that crashed — the fix is to keep the dump path lock-free and preallocated. Another is silent log loss when the writer thread cannot keep up; monitor a dropped-record counter and alert on it.
Finally, treat the dump format as a contract. Version it, document it, and write a parser test that round-trips a known state. When the solver evolves, the analysis tooling must not break — otherwise the diagnostics you invested in become unreadable exactly when you need them most.