1. Course introduction
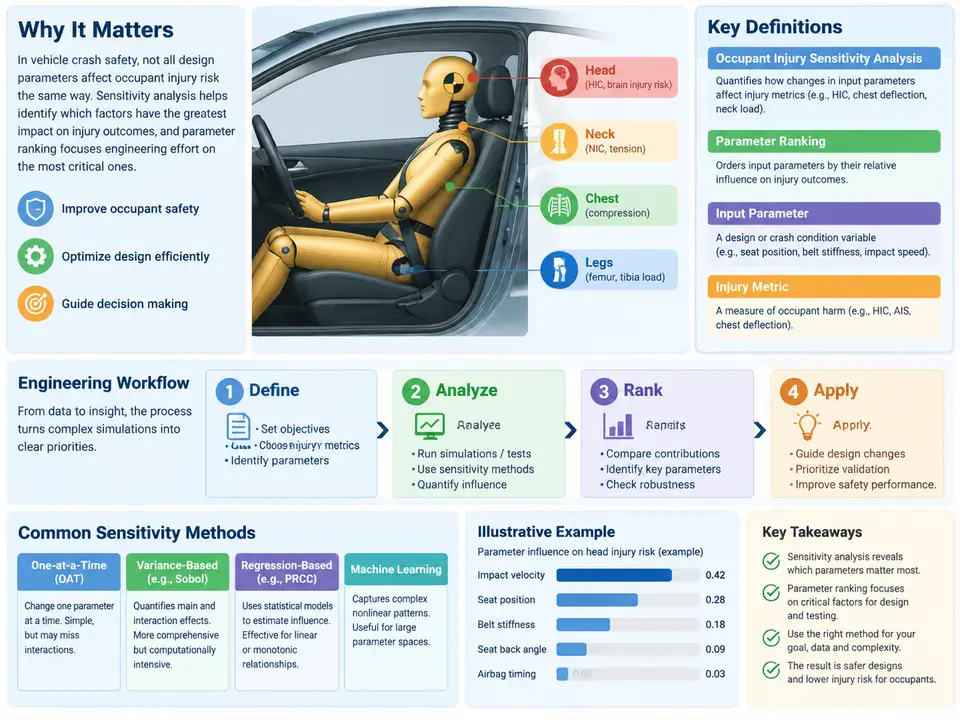
In vehicle crash safety development, engineers rarely have the luxury of optimizing a single variable. A body structure, restraint system, and occupant package are defined by dozens of interacting parameters — sheet-metal gauges, material grades, hinge and latch stiffness, airbag vent sizes, inflator outputs, seat-belt load limiters, pretensioner timing, seat cushion angle, and occupant posture. Each of these influences occupant injury outcomes, but not equally. Occupant injury sensitivity analysis is the systematic study of how variation in these input parameters propagates to occupant injury metrics, and parameter ranking is the process of ordering those parameters by the magnitude and reliability of their influence so that engineering effort, CAE budget, and physical test hardware are spent where they matter most.
The purpose of this opening chapter is to establish a shared vocabulary, clarify what sensitivity actually means in a crash-safety context, and lay out the end-to-end engineering workflow that the remainder of the course will build on. By the end, you should be able to look at a restraint-system development problem and describe, in concrete terms, what inputs you would vary, what outputs you would measure, how you would quantify influence, and how you would turn that quantification into a defensible ranking.
Why Sensitivity and Ranking Matter
A full-vehicle frontal crash simulation with a detailed dummy model may take several hours to several days per run on a high-performance cluster. A restraint system alone can carry 20–40 design variables. Exhaustive grid exploration is therefore infeasible, and even if it were affordable, most of the resulting information would be wasted: in practice a small subset of parameters dominates occupant response, while many others contribute little more than noise. Sensitivity analysis compresses a high-dimensional design space into an actionable shortlist. Ranking then answers the practical question every program manager asks: if we can only change three things before the next hardware build, which three?
Ranking also supports robustness thinking. A parameter that strongly shifts the mean injury value is a performance lever; a parameter that strongly amplifies scatter under manufacturing and usage variation is a robustness risk. These are different concerns, and a good ranking distinguishes them.
Key Definitions
Input parameter (factor). A controllable or uncertain quantity that defines the model — for example, seatbelt_load_limit in kN, airbag_vent_diameter in mm, or pretensioner_fire_time in ms. Each parameter has a nominal value and a plausible range derived from tolerance, supplier capability, or packaging constraints.
Response (output metric). The quantity used to judge occupant outcome. Common examples include Head Injury Criterion (HIC15), 3 ms chest acceleration (a3ms), chest deflection (Dmax), femur axial force, and the normalized injury assessment reference values used in consumer and regulatory protocols. Responses must be extracted consistently — same filter class, same time window, same dummy version — or the sensitivity results become incomparable.
Sensitivity. The change in a response caused by a change in an input, expressed either locally (a partial derivative or a small-perturbation slope) or globally (variance contribution across the whole parameter range). Local sensitivity is cheap but only valid near the nominal point; global sensitivity captures nonlinearity and interaction but requires a designed experiment or sampling campaign.
Interaction. When the effect of one parameter depends on the level of another — for instance, the benefit of a softer load limiter may only appear when pretensioner timing is early enough. Interaction is the main reason one-at-a-time (OAT) studies can mislead.
Ranking. An ordered list of parameters by influence on a chosen response, ideally accompanied by a confidence statement and a note on whether the ranking is stable across responses and operating conditions.
The Engineering Workflow
The workflow below is the backbone of this course. It is iterative: ranking results frequently send engineers back to redefine ranges or add parameters.
- Define the assessment scope. Fix the crash mode (e.g., 50 km/h full frontal rigid barrier, or 64 km/h 40% offset deformable barrier), occupant size (5th percentile female, 50th percentile male), seating position, and the regulatory or consumer rating targets. Scope determines which responses matter.
- Build and correlate the baseline model. The CAE model must first reproduce available physical test results within an agreed tolerance. Sensitivity results from an uncorrelated model are systematically biased and can invert the true ranking.
- Select parameters and ranges. List candidate factors, assign nominal values, and set lower/upper bounds from tolerances, supplier data sheets, or packaging limits. Document the source of every range.
- Choose the sensitivity method. OAT perturbation for screening, Design of Experiments (DOE) with regression or ANOVA for main effects and interactions, variance-based methods (e.g., Sobol indices) for global contribution, and metamodel-based approaches when run count is constrained.
- Execute the design and extract responses. Run the matrix, post-process each run with a scripted, identical extraction pipeline, and store results in a structured table keyed by run ID.
- Quantify and rank. Compute sensitivity measures per response, normalize them for comparability, and produce a ranked table. Check ranking stability across responses and operating conditions.
- Interpret and act. Translate the ranking into design decisions: which parameters to fix, which to optimize, which to control tightly in manufacturing, and which to investigate further with higher-fidelity models or physical tests.
Worked Example: Screening a Frontal Restraint System
Consider a 50th percentile male occupant in a 50 km/h full-frontal simulation. Suppose the team selects five factors for an initial screen: seatbelt_load_limit (3.0–4.5 kN), pretensioner_fire_time (10–25 ms), airbag_vent_diameter (25–40 mm), seat_cushion_angle (12–18°), and steering_column_stroke (60–90 mm). A two-level fractional factorial design with resolution sufficient to separate main effects requires only 8 runs instead of 32 for a full factorial. Responses are HIC15, a3ms, and Dmax.
After running the matrix and fitting a main-effects model, the engineer obtains standardized effect magnitudes. A plausible illustrative outcome — clearly a teaching example, not measured data — might show seatbelt_load_limit dominating chest deflection, airbag_vent_diameter dominating HIC15 through head deceleration, and pretensioner_fire_time showing a strong interaction with load limit. The ranking would then read: load limit first for chest, vent diameter first for head, with pretensioner timing flagged as an interaction partner rather than an independent lever. That distinction directly shapes the next design iteration.
Reading the Workflow Diagram
The figure below maps the workflow as a signal-and-decision chain: parameter ranges and the correlated baseline feed a designed experiment, whose runs produce raw responses that are extracted and reduced to sensitivity measures, then ranked and interpreted. The feedback arrows show the two most common loops — redefining ranges after a ranking proves unstable, and returning to correlation when results contradict physical expectation.
Common Pitfalls at the Outset
Three failure modes appear repeatedly in first-pass sensitivity studies. First, uncorrelated baselines: if the model over-predicts chest deflection by 20%, the ranking may still be directionally useful, but the absolute sensitivity magnitudes will be wrong and the design targets derived from them unreliable. Second, range inflation: setting a load-limiter range from 2.0 to 6.0 kN when the supplier can only deliver 3.5–4.5 kN produces a ranking that reflects an unrealizable design space. Third, response inconsistency: extracting HIC15 with different filter classes across runs introduces artificial scatter that can swamp the true parameter effect and scramble the ranking.
What This Course Will Build
The chapters that follow develop each stage of this workflow in depth: designing screening and global experiments, computing and normalizing sensitivity measures, handling interactions and nonlinearity, assessing ranking stability, and converting rankings into design and validation decisions. The consistent thread is that a ranking is only as trustworthy as the model, ranges, and response definitions behind it — and that the engineer's job is to make those assumptions explicit, testable, and defensible.