1. CAE process variation
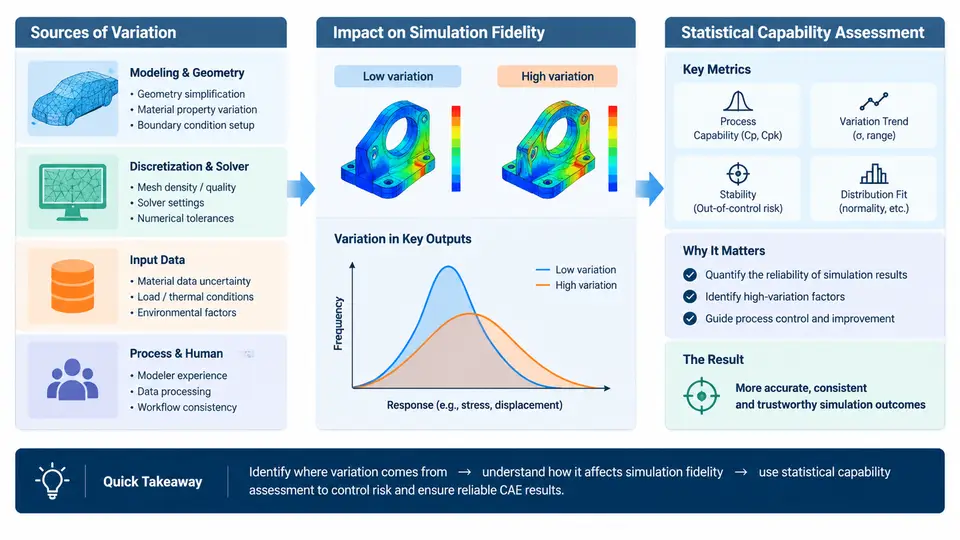
In Computer-Aided Engineering (CAE), a simulation result is often treated as a single deterministic number: one displacement, one stress peak, one temperature. In reality, every CAE result is the output of a process that contains variation at every stage — from the geometry that enters the solver to the mesh, the material model, the boundary conditions, and the numerical settings. Understanding where that variation comes from, how it propagates into the predicted response, and why a single run cannot characterize a process is the foundation for everything that follows in statistical capability assessment.
Where variation enters the CAE process
CAE process variation can be grouped into four interacting families. Input variation covers the physical uncertainty of the problem: manufacturing tolerances on dimensions, material property scatter (Young's modulus, yield strength, density), and variability in loading and environmental conditions. Modeling variation arises from the analyst's choices: CAD simplification, idealization of contacts and joints, element type and mesh density, and the constitutive model selected. Numerical variation comes from the solver itself: discretization error, convergence tolerances, time-step size in explicit analyses, and round-off. Procedural variation is the human and workflow component: different analysts, different meshing strategies, different post-processing extraction locations, and different versions of the same solver.
A useful way to see how these families combine is to trace a single quantity — say, peak von Mises stress in a bracket — through the process chain. The diagram below shows the propagation path and where each source acts.
How variation degrades simulation fidelity
Variation matters because it changes the answer. Consider a simple linear-elastic bracket model with a nominal peak stress of 180 MPa. If the analyst changes only the mesh from a coarse second-order tetrahedral mesh (element size 4 mm) to a refined one (2 mm), the peak stress at a fillet can shift by 10–20% purely from discretization — not because the part changed, but because the stress gradient is being sampled differently. Add material scatter of ±5% in Young's modulus and ±8% in yield strength, and the predicted safety factor moves by a comparable amount. Change the contact formulation from bonded to frictional, and the load path itself can change.
The consequence is that fidelity is not a property of a single run. Fidelity is the agreement between the simulation process output distribution and the physical reality it represents. A model that matches one physical test at one operating point may still have poor fidelity across the population of parts and conditions it is meant to represent. This is the core reason why deterministic "pass/fail" simulation reviews are insufficient for design decisions: they answer "what is the value for this one configuration?" rather than "how reliably does this process predict the population?"
Why statistical capability assessment is required
Statistical capability assessment answers a different question than verification and validation. Verification asks "are we solving the equations correctly?" Validation asks "are we solving the right equations?" Capability asks "is the process — analyst, model, solver, and workflow together — stable and precise enough to produce decisions with known risk?"
Three conditions make capability assessment necessary in CAE. First, decisions are made at the tails: a design is judged by its worst-case stress, not its mean, so the shape of the output distribution matters more than any single value. Second, the process itself is a measurement system: like a gauge on a production line, the CAE workflow has repeatability and reproducibility, and those must be quantified before its outputs can be trusted. Third, improvement requires a baseline: without a capability index, there is no way to tell whether a new meshing guideline, a solver upgrade, or a training program actually reduced variation.
A minimal capability assessment for a CAE process typically involves: (1) defining the response of interest and its specification limits; (2) executing the process repeatedly under controlled variation of the dominant factors (a designed experiment or a Monte Carlo study over input distributions); (3) estimating the output mean and standard deviation; and (4) computing capability indices such as Cp and Cpk, or Ppk when the process is not in statistical control. For the bracket example, if repeated process executions yield σ_max with mean 182 MPa and standard deviation 9 MPa against an allowable of 210 MPa, then Cpk ≈ (210 − 182) / (3 × 9) ≈ 1.04 — marginally capable, and a signal that mesh and material variation should be reduced before the model is used for release decisions.
| Variation source | Typical control lever | Observable symptom of poor control |
|---|---|---|
| Mesh density | Mesh convergence study; element size at gradients | Peak stress shifts >5% between mesh levels |
| Material scatter | Test-backed property distributions; sensitivity study | Safety factor changes sign of margin across plausible inputs |
| Contact idealization | Benchmark against instrumented test; formulation audit | Load path or reaction forces differ from physical measurement |
| Analyst procedure | Templates, checklists, post-processing scripts | Two analysts report different peaks from the same model |
The practical takeaway for this course is that CAE process variation is not noise to be ignored or averaged away — it is a measurable property of the workflow that determines whether simulation results can support engineering decisions. The chapters that follow build the statistical toolkit to quantify that variation, separate its sources, and drive the process toward a state of demonstrated capability.