1. Crash engineering decision context
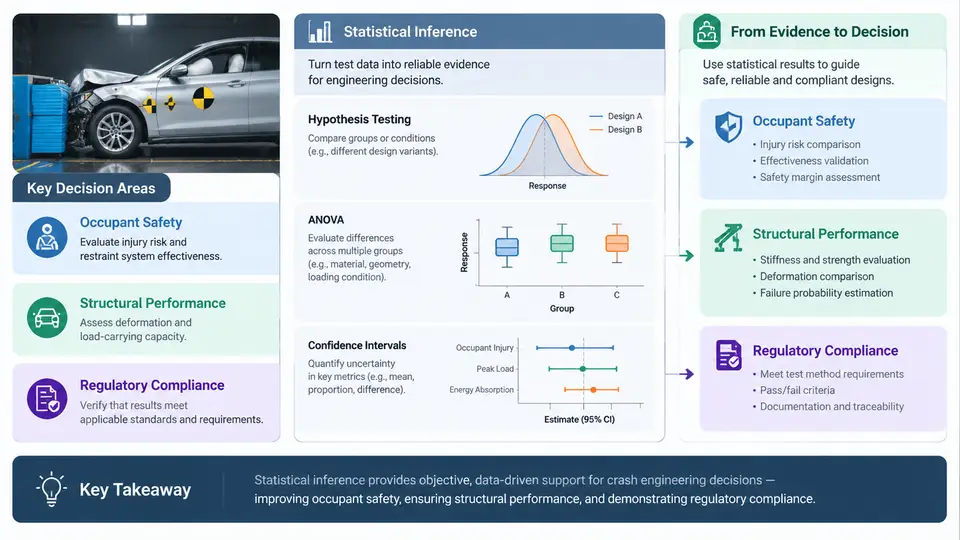
Crash engineering is fundamentally a decision discipline conducted under uncertainty. Whether the question is whether a restraint calibration is ready for a production release, whether a body-in-white (BIW) variant meets a side-impact target, or whether a fleet of test results demonstrates compliance with FMVSS 208 or UN R94, the engineer is never working with the full population of vehicles that will ever be built. Instead, decisions are made from a finite set of physical sled tests, full-vehicle barrier impacts, component drop-tower runs, and CAE simulations. Statistical inference is the formal bridge between that limited evidence and the engineering or regulatory claim being made. This chapter establishes why inference is not an academic overlay on crash work but the mechanism by which test data becomes a defensible decision.
Why Crash Data Is Inherently Variable
Two nominally identical vehicles tested to the same barrier impact will not produce identical occupant responses. Sources of variability are stacked and interacting: build variation in sheet-metal thickness and weld quality, variation in restraint hardware (pretensioner timing, airbag inflator output, fold pattern), sensor and data-acquisition tolerance, dummy certification state and instrumentation drift, ambient temperature and humidity, barrier alignment, and test-setup repeatability. In CAE, variability enters through material card scatter, mesh and contact settings, and boundary-condition assumptions. The result is that a single Hybrid III 50th-percentile chest deflection value, or a single peak longitudinal B-pillar intrusion, is a sample — not the truth about the design.
This matters because regulatory criteria are threshold-based. FMVSS 208, for example, sets occupant injury criteria such as HIC 15, chest deflection, and neck injury values that must not be exceeded in specified test configurations. A design whose mean response sits comfortably below a limit can still fail a certification test if the response distribution has a wide tail. Conversely, a design with a mean close to the limit may pass a given test by luck. Statistical inference is what allows the engineer to reason about the distribution of outcomes and the probability of exceeding a criterion, rather than about a single observed number.
Three Decision Domains, One Inferential Framework
Crash engineering decisions cluster into three domains, and each maps naturally onto a class of statistical questions.
- Occupant safety: Is the mean or high-percentile occupant response of a restraint configuration below an injury threshold, and is a design change a genuine improvement or within noise? This is a question of comparing means and estimating tail risk — hypothesis tests on means, confidence intervals, and tolerance/probability-of-exceedance analysis.
- Structural performance: Does a BIW or subsystem variant change crashworthiness metrics such as intrusion, deceleration pulse, or energy absorption in a statistically meaningful way? This is a comparison-of-groups problem — two-sample tests, paired tests on matched configurations, and ANOVA when several design factors or variants are compared simultaneously.
- Regulatory compliance: Can the manufacturer demonstrate, with defined confidence, that the production population meets a regulated criterion? This is an inference-to-population problem — often framed as demonstrating a proportion below a limit, or establishing a statistical basis for a compliance claim from a limited certification test matrix.
The unifying idea is that every one of these questions is a claim about a population parameter (a mean, a variance, a proportion, or a difference between groups), tested against evidence from a sample. The choice of test — t-test, ANOVA, proportion test, or a tolerance-interval approach — follows from the structure of the claim and the data, not from convention.
What "Statistical Inference" Actually Does Here
Inference proceeds by stating a claim precisely and then asking how surprising the observed data would be if the claim were true. In crash work the claim is usually framed as a null hypothesis (for example, "the mean chest deflection of configuration A equals that of configuration B") against an alternative ("configuration B reduces mean chest deflection"). The test returns a p-value: the probability of observing data at least as extreme as ours, assuming the null is true. A small p-value is evidence against the null. Equally important, the test returns an effect size and a confidence interval, which state how much the response changed and how precisely we know it — information a p-value alone cannot provide.
Consider a concrete, illustrative example. A team runs five sled tests of a baseline restraint and five of a modified pretensioner strategy, measuring peak chest deflection (mm). Suppose the baseline sample gives a mean of 42.0 mm with a standard deviation of 2.1 mm, and the modified sample gives 39.5 mm with a standard deviation of 1.8 mm. A two-sample t-test (Welch's, not assuming equal variances) yields an estimated mean difference of −2.5 mm with a 95% confidence interval of roughly −5.1 to +0.1 mm and a p-value near 0.06. The correct reading is not "the modification works" or "it does not." It is: the point estimate favors the modification, but the confidence interval still includes zero, so the evidence is inconclusive at the 5% level. The engineering decision may be to run additional tests, tighten the measurement, or accept the change on other grounds — but the statistical result has honestly bounded what the data can support. (These numbers are a constructed teaching example, not measured results.)
From Inference to a Defensible Decision
The practical workflow that this course builds toward has a consistent shape, even though the specific tests vary by chapter. First, define the decision and the claim in engineering terms — which metric, which threshold, which comparison. Second, characterize the data: sample size, independence, distributional shape, and known sources of variability. Third, select the inference method that matches the claim and the data structure (a two-sample comparison, a multi-group ANOVA, a proportion or tolerance approach). Fourth, compute the estimate, the interval, and the test statistic, and interpret them together. Fifth, translate the statistical result into an engineering action: release, iterate, expand testing, or escalate.
Two failure modes recur and are worth naming early. The first is treating a single passing test as proof of compliance; a sample of one carries no information about the population tail. The second is over-interpreting a non-significant result as evidence of no effect — absence of evidence is not evidence of absence, especially with small crash-test samples. Both are inference errors, and both have real safety and regulatory consequences.
Why This Course Uses Hypothesis Testing and ANOVA
Hypothesis testing provides the formal language for "is this difference real?" ANOVA extends that language to the common crash-engineering situation where several factors or variants are compared at once — for example, three pretensioner timings crossed with two airbag vent sizes — and where interaction effects (a timing that helps only with a particular vent size) are exactly the kind of finding that single-comparison tests miss. Later chapters build from the logic of the t-test through one-way and factorial ANOVA, assumptions and diagnostics, and the interpretation of results in the specific context of occupant safety, structural performance, and regulatory compliance. The goal throughout is not statistical sophistication for its own sake, but the ability to make crash-engineering decisions that are honest about what the evidence supports.