1. Role of probability and statistics in cr
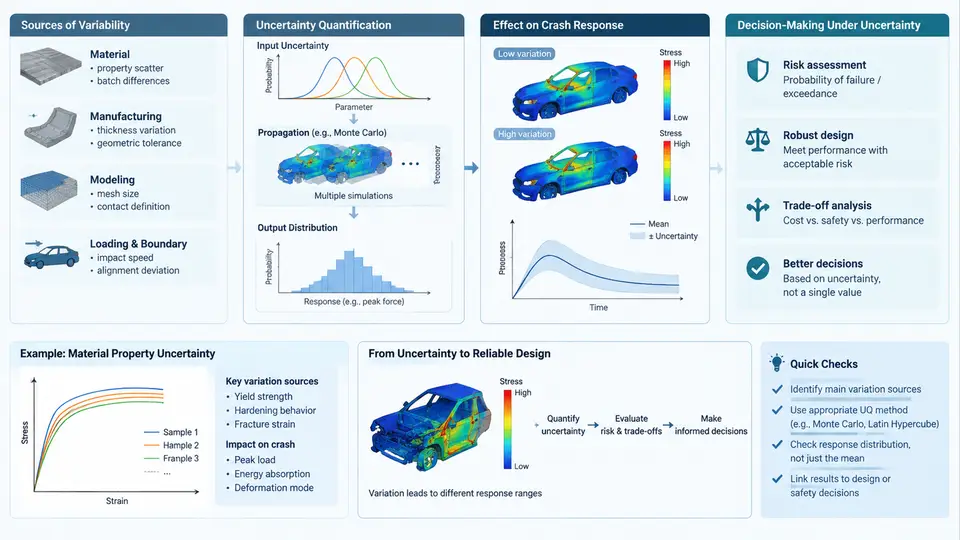
Crash CAE is often presented as a deterministic discipline: define the geometry, assign the material cards, set the initial velocity, run the explicit solver, and read the peak intrusion from the animation. In reality, no two physical crash tests are identical, and no two validated CAE models are identical either. Sheet metal thickness varies within rolling tolerances, spot welds land a few millimetres from their nominal positions, foam density drifts between batches, friction coefficients depend on surface condition and humidity, and the solver itself introduces discretization and time-step effects. Probability and statistics provide the language for describing this spread, quantifying how it propagates to occupant and structural responses, and making defensible engineering decisions when the answer is a distribution rather than a single number.
Where the variability actually comes from
A useful way to organize crash CAE variability is by origin, because the origin determines both the magnitude of the scatter and the practical way to treat it.
- Physical aleatory variability. Manufacturing tolerances (gauge, yield strength, bake-hardening), material batch-to-batch scatter, weld and adhesive process capability, and assembly variation. These are irreducible in the sense that they exist in the produced population; they can be characterized but not eliminated.
- Model-form and parameter uncertainty. Constitutive models (Johnson–Cook, Cowper–Symonds, GISSMO damage) are calibrated to coupon data with limited coverage of strain rate and stress triaxiality. The calibration itself carries uncertainty, and the chosen model form is an approximation.
- Numerical uncertainty. Element size, hourglass control, contact penalty stiffness, mass scaling, and time-step size all shift results. A mesh convergence study reduces but never removes this contribution.
- Boundary and loading uncertainty. Impact angle, barrier alignment, velocity at contact, occupant posture and belt routing in sled or full-vehicle setups.
The distinction matters because aleatory variability is handled by propagating distributions through the model, whereas epistemic uncertainty is reduced by more testing, better calibration, or mesh refinement. Mixing the two leads to either over-conservative designs or false confidence.
Uncertainty quantification in practice
Uncertainty quantification (UQ) in crash CAE typically follows a four-stage logic: characterize inputs, propagate them, analyze the output distribution, and use it for a decision. The figure below shows this chain together with the typical crash-specific quantities involved.
In a typical frontal-rail study, the analyst might assign a normal distribution to gauge thickness with mean 1.20 mm and standard deviation 0.03 mm, a normal distribution to yield strength with mean 340 MPa and standard deviation 18 MPa, a uniform distribution to weld offset between 0 and 8 mm, and a uniform distribution to friction between 0.10 and 0.20. A Latin Hypercube sample of 60 designs, each solved with the same validated explicit model, is a realistic starting point for a single-rail subsystem. The output is not one intrusion curve but a family of curves, from which a mean, a standard deviation, and a 95th percentile can be extracted. The 95th percentile is the quantity that matters for a requirement written as "intrusion shall not exceed 160 mm," because it answers the question "what will the worst 5% of the produced population do?" rather than "what does the nominal model do?"
Sensitivity is as important as the distribution
A distribution without attribution is only half the answer. Variance-based sensitivity analysis, usually through Sobol indices or a cheaper regression-based screening step, tells the engineer which input dominates the output scatter. If gauge thickness contributes 52% of the variance in intrusion and yield strength 31%, then tightening the gauge specification or negotiating a narrower steel coil tolerance is a far more effective risk-reduction action than adding another weld. This is the practical payoff of UQ: it converts a vague "the model is uncertain" statement into a ranked list of variables worth controlling.
Decision-making under uncertainty
Crash requirements are written as thresholds, but the underlying physics is statistical. A design that passes at the nominal point with 2 mm of margin may fail in 15% of production if the scatter is 10 mm. Decision-making under uncertainty therefore replaces the binary pass/fail with a probabilistic statement: the probability of exceeding the intrusion limit, the confidence interval on that probability given a finite number of samples, and the cost of being wrong. Two designs can both have a mean intrusion of 140 mm yet differ substantially in P95, and the one with the tighter tail is the safer release.
This framing also changes how validation is interpreted. A physical crash test is a single draw from the population, not a ground truth. When a CAE prediction and a test result differ by 8 mm, the correct question is whether that difference lies inside the combined model and test uncertainty band, not simply whether the model "matches." Establishing that band requires repeated tests, measurement uncertainty analysis, and a documented correlation metric such as the ISO/TS 18571 objective rating, which scores the whole curve rather than a single peak.
A minimal working workflow
For a first pass on a subsystem, a defensible workflow is: (1) list the five to eight inputs with the largest expected effect and assign distributions from coupon data, CMM reports, or supplier capability; (2) run a 40–60 point Latin Hypercube design; (3) fit a surrogate and check its R² and hold-out error; (4) extract mean, standard deviation, P95, and Sobol indices; (5) compare P95 against the requirement and, if it fails, act on the top-ranked variable. The output of this loop is a decision record — the assumed distributions, the sample size, the surrogate quality, the resulting percentile, and the chosen action — which is exactly what a design review needs in order to accept a statistical margin instead of a nominal number.
Probability and statistics do not make crash CAE softer or less rigorous; they make it honest about what a single deterministic run can and cannot tell you. The engineer who can state a distribution, attribute its variance, and defend a percentile-based decision is in a far stronger position than one who reports a single peak value and hopes the test agrees.