1. Crash simulation in product development
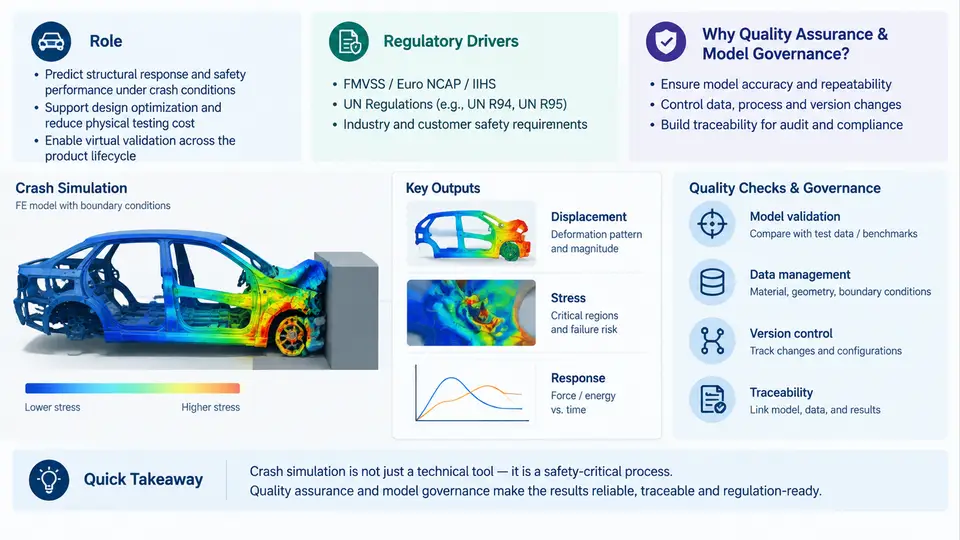
Crash simulation is the numerical prediction of how a vehicle structure, restraint system, and occupant respond to a collision event. In modern product development it is not a single analysis but a family of tightly coupled models: full-vehicle frontal and side impact, sled tests, component-level crush, occupant restraint (Hybrid III, THOR, WorldSID), pedestrian protection, and battery-pack intrusion for electrified platforms. Each model consumes CAD geometry, material cards, joining definitions, and boundary conditions, and each produces results that feed design decisions, homologation evidence, and safety ratings. The central engineering question is therefore not "can we run a crash model?" but "can we trust the number that comes out, and can we prove that trust to a regulator, a customer, and an internal review board?"
What crash simulation actually delivers
A crash model is a discretized representation of a physical event. The solver (LS-DYNA, PAM-CRASH, Radioss, or Abaqus Explicit) integrates the equations of motion over a short, highly nonlinear time window — typically 100–150 ms for a frontal barrier impact. The output that matters is not the animation but a set of scalar and time-history responses: occupant injury criteria (HIC15, HIC36, chest deflection, femur load, neck Nij), structural metrics (B-pillar intrusion, firewall penetration, steering-column displacement), and energy balance (hourglass energy, internal energy, sliding interface energy).
Consider a representative frontal 56 km/h rigid-barrier load case. The model contains roughly 3–8 million elements, 200–400 material definitions, and 1,500–4,000 spot welds and structural adhesives. A single run on 64–128 cores takes 6–20 hours. The result is only useful if the model is numerically stable and physically representative. Two numbers tell you immediately whether the run is trustworthy: hourglass energy should stay below 5% of peak internal energy, and added mass from mass scaling should remain below 1–2% of total model mass. If either threshold is exceeded, the predicted intrusion and injury values are suspect regardless of how plausible the contour plot looks.
Regulatory and rating drivers
Crash simulation sits inside a dense regulatory framework. FMVSS 208 (occupant crash protection), FMVSS 214 (side impact), FMVSS 216a (roof crush), and FMVSS 305 (electric vehicle electrolyte spillage) define mandatory performance. Euro NCAP, C-NCAP, and IIHS add rating protocols that are often more severe than the legal minimum. UN R94, R95, and R137 govern European type approval. For battery-electric vehicles, GB 38031 and the evolving side-pole and bottom-impact requirements add new load cases that did not exist a decade ago.
The consequence for simulation is that a model is not validated once. It must be correlated against physical test data for each load case, each occupant size, and each major design change. A correlation package typically includes:
- Barrier force–displacement curves from the physical test versus the simulation.
- Accelerometer time histories at the B-pillar, rocker, and tunnel.
- High-speed video overlay at 1,000–2,000 fps for deformation-sequence comparison.
- Occupant response corridors from the sled or full-vehicle test.
Correlation is judged with quantitative metrics, not visual similarity. Common acceptance criteria are a CORrelation and Analysis (CORA) rating above 0.7 for key channels, a peak-value deviation within ±10%, and a time-of-peak shift under 5 ms. A model that passes visual review but fails CORA on the chest-deflection channel is not correlated.
The quality problem in practice
Model quality failures are rarely dramatic. They accumulate quietly. A material card is updated for a new steel grade but the strain-rate curve is left from the previous grade. A spot-weld failure criterion is tuned for one platform and silently reused on another with different sheet thickness. A mass-scaling factor is increased to meet a deadline, and the resulting inertia change shifts the occupant kinematics. A contact thickness is left at default, producing penetration that is masked by a smooth animation.
These are governance failures, not solver failures. They occur because the model is treated as a file rather than a controlled engineering artifact. The practical response is a model governance framework with four concrete elements:
- Model identification and versioning. Every model carries a unique ID, a revision number, a baseline reference, and a change log. The ID appears in every result deck and report.
- Defined acceptance criteria. Numerical thresholds for hourglass energy, added mass, negative volume, and contact penetration are checked automatically before results are released.
- Correlation traceability. Each load case links to the physical test it was correlated against, the CORA score, and the date of correlation.
- Change impact assessment. Any modification to geometry, material, joining, or boundary conditions triggers a documented re-correlation decision.
From model to decision: a worked check
Suppose a side-impact model predicts a B-pillar intrusion of 142 mm at 50 km/h MDB, and the physical test measured 128 mm. Before adjusting the model, the engineer should verify the run quality first. A practical pre-release check sequence is:
1. Hourglass energy / peak internal energy  -> must be < 5%
2. Added mass / total model mass            -> must be < 2%
3. Negative volume elements                 -> must be 0
4. Initial penetration in contacts          -> must be < 0.5 mm
5. Energy ratio (total / initial kinetic)   -> must be 0.95–1.05
6. Rigid-wall force vs. test barrier force  -> peak within ±10%
If checks 1–5 pass but the intrusion still deviates by 14 mm, the discrepancy is physical, not numerical. The likely causes are material strain-rate data, weld failure timing, or contact friction. If check 1 or 2 fails, the discrepancy is numerical and the model must be corrected before any physical interpretation is attempted. This distinction — numerical validity before physical accuracy — is the core discipline that quality assurance enforces.
Why this course treats QA and governance as one system
Quality assurance answers "is this result valid?" Model governance answers "is this model controlled, traceable, and reusable?" They are inseparable. A valid result from an uncontrolled model cannot be reproduced. A controlled model without numerical acceptance criteria can still produce invalid results. Together they form the evidence chain that regulators, rating agencies, and internal safety boards require.
The sections that follow build this system layer by layer: model build standards, material and joining data management, numerical health checks, correlation methodology, occupant and structural validation, and the documentation and review workflow that keeps a crash model trustworthy across its entire service life.