1. Automotive CAE project landscape
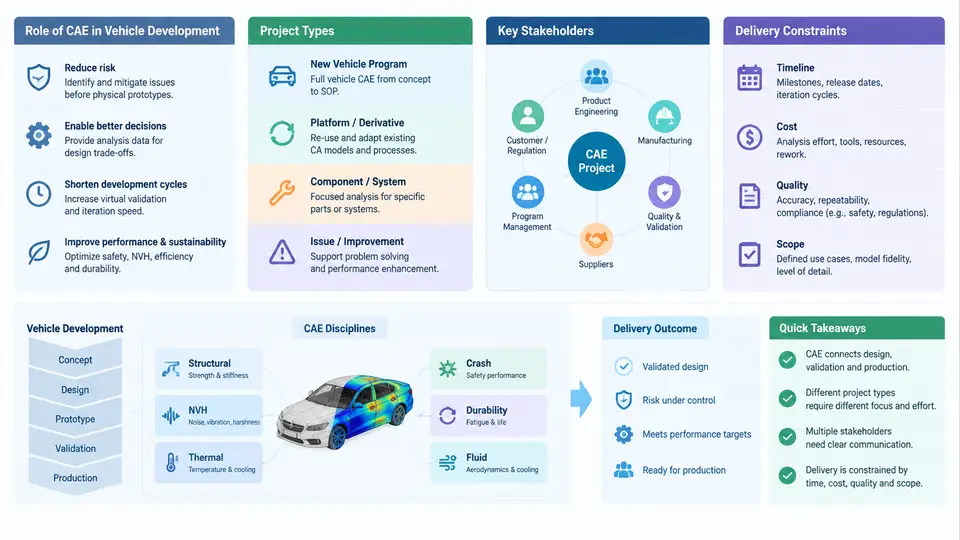
Computer-Aided Engineering (CAE) in automotive development is not a single activity but a portfolio of simulation disciplines embedded at specific decision points in the vehicle program. Understanding the landscape means knowing where CAE sits in the development timeline, what kinds of projects it serves, who consumes its results, and which constraints govern its delivery. This chapter establishes that map before any tool, mesh, or solver is discussed.
Where CAE Sits in Vehicle Development
A modern passenger vehicle program typically runs 36–48 months from concept freeze to Start of Production (SOP). CAE work does not begin after design; it runs concurrently and often ahead of detailed CAD. The classic V-model describes the logic: requirements decompose into subsystem targets, design and simulation iterate at each level, then verification and validation close the loop against the original targets.
In practice, CAE deliverables cluster into four program phases:
- Concept / target setting (months 0–6): 1D system models, simplified beam/shell body models, benchmarking of competitor vehicles. Output: attribute targets (e.g., BIW torsional stiffness ≥ 28 kN·m/deg, frontal crash pulse corridor, cabin SPL targets).
- Detailed design support (months 6–24): full-vehicle crash FE models, NVH modal and forced-response runs, CFD for thermal and aerodynamics, durability load cases. Output: design direction, gauge/thickness/geometry recommendations.
- Verification (months 24–36): correlation against physical test, design-of-experiments (DoE) robustness studies, final sign-off runs. Output: compliance evidence for gate reviews.
- Launch support (months 36–48): root-cause simulation for build or test failures, tolerance and variation studies, field-issue investigation.
The critical management insight: CAE is a decision-support function. A simulation that arrives after the design freeze has near-zero value regardless of its technical quality. Delivery timing is therefore a first-class constraint, not an afterthought.
Project Types and Their Characteristics
CAE projects differ substantially in scope, model fidelity, and turnaround expectation. Recognizing the type early determines the correct planning approach.
| Project type | Typical model size | Turnaround | Primary consumer |
|---|---|---|---|
| Concept / 1D system | 10²–10³ DOF | Hours–days | Attribute planning |
| Subsystem FE (e.g., door slam, seat frame) | 10⁵–10⁶ elements | 1–3 days | Component engineer |
| Full-vehicle crash | 5×10⁶–2×10⁷ elements | 8–72 h per run | Safety integration |
| Full-vehicle NVH | 10⁶–5×10⁶ elements | 4–24 h per load case | NVH attribute owner |
| CFD (aero / thermal) | 10⁷–10⁸ cells | 12–96 h | Thermal & aero teams |
| DoE / optimization campaign | Varies; 20–200 runs | 1–4 weeks | Design & attribute leads |
Each type carries a different risk profile. A concept 1D model tolerates rough assumptions; a full-vehicle crash model used for regulatory sign-off demands documented correlation and mesh-quality evidence. Project management must scale rigor accordingly — applying crash-model governance to a concept study wastes resources, while treating a sign-off run casually creates compliance risk.
Stakeholders and Their Expectations
CAE sits between design, test, and program management. Each stakeholder group asks different questions and applies different acceptance criteria.
- Body/Chassis design engineers: "Which panel thickness or bead pattern best meets stiffness with minimum mass?" They need comparative results and clear design direction, not raw contour plots.
- Attribute owners (safety, NVH, durability, thermal): "Does the current design meet the target, and what is the margin?" They need quantified margins against targets and sensitivity to variation.
- Test & validation: "Can your model predict what we will measure?" They need correlation evidence — model vs. test overlay, error percentages, boundary-condition fidelity.
- Program management: "Will this gate be met, and what is the risk if not?" They need status, confidence level, and mitigation options in program language.
- Suppliers: "What CAE evidence must we submit, in what format, by when?" They need a defined data-exchange specification and acceptance checklist.
A frequent failure mode is delivering a technically correct result in a form the consumer cannot act on. A 200-page stress report with no recommendation is not a deliverable; a one-page summary stating "thickness increase from 1.2 mm to 1.5 mm on the B-pillar inner meets the side-impact target with 8% margin, adding 0.9 kg" is.
Delivery Constraints
CAE delivery is bounded by four interacting constraints that project managers must balance continuously:
- Time: Gate reviews are fixed. A crash simulation that finishes one day after the design freeze decision meeting has missed its window. Planning must work backward from gate dates, not forward from model availability.
- Compute resources: A full-vehicle crash run may consume 500–2000 CPU-core-hours. A DoE campaign of 50 runs can saturate a cluster for weeks. Queue time is a real schedule element, not an IT detail.
- Model readiness: CAE cannot start until CAD geometry is at a sufficient maturity level. Premature meshing of unstable geometry causes rework; excessive waiting compresses the analysis window. Defining a "CAE-ready geometry" checklist is a core management tool.
- Accuracy vs. speed: Higher fidelity improves confidence but costs time. The appropriate fidelity level is determined by the decision at stake, not by analyst preference.
Visualizing the CAE Delivery Landscape
The following diagram maps the relationship between program phases, CAE project types, primary stakeholders, and the dominant constraint at each stage. It is a planning reference: for any new CAE request, locate it on this map to identify the expected turnaround, the consumer, and the binding constraint.
Practical Implications for Project Planning
When a CAE request arrives, the project manager should immediately classify it along three axes: which program phase, which project type, and which stakeholder decision it supports. This classification determines the appropriate model fidelity, the acceptable turnaround, the required documentation level, and the compute budget.
For example, a request during detailed design for "door slam durability" maps to a subsystem FE project, consumer is the closure design engineer, turnaround expectation is 1–3 days, dominant constraint is model readiness (the door CAD must be at a stable release level), and the deliverable is a comparative stress/life contour with a pass/fail recommendation against the durability target. A request during launch for "water leak investigation" maps to a root-cause CFD or thermal project, consumer is quality engineering, turnaround is hours-to-days, dominant constraint is time (the issue is blocking production), and the deliverable is a root-cause hypothesis with a proposed countermeasure validated by simulation.
This landscape view — phases, project types, stakeholders, and constraints — forms the foundation for everything that follows: scoping, resource planning, model quality management, correlation, and delivery. The remaining chapters build the operational detail on top of this map.