1. Course overview
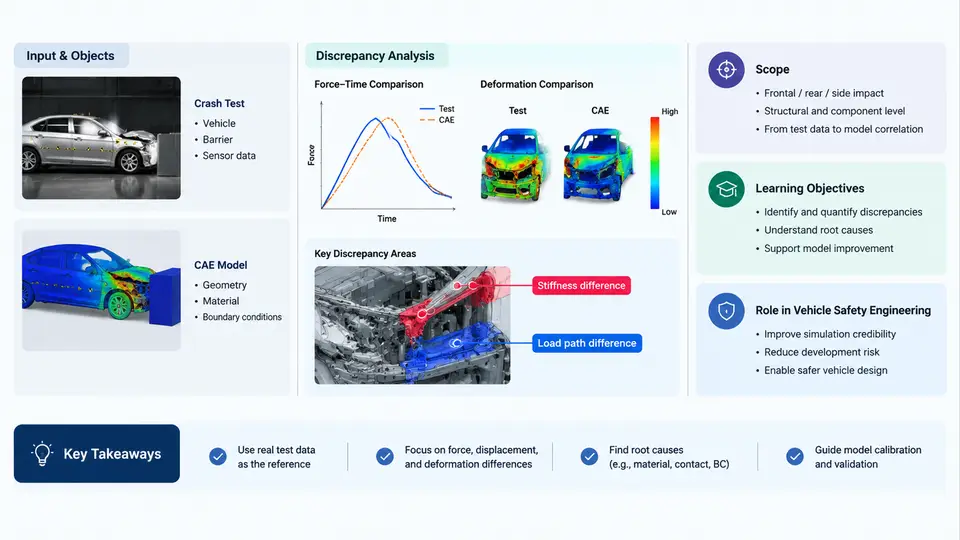
Vehicle safety engineering depends on a simple but demanding proposition: the crash performance predicted by a CAE model must match what actually happens in a physical crash test. When the two diverge, engineers face a crash test to CAE model discrepancy — a measurable gap between simulated response and observed physical behavior. This course is dedicated to understanding, quantifying, and systematically reducing that gap. It sits at the intersection of occupant safety, structural crashworthiness, finite element (FE) modeling, and data-driven analysis, and it treats discrepancy not as a nuisance to be hidden but as the central engineering signal to be explained.
The scope of the course spans the full discrepancy analysis workflow. It begins with the physical test as a measurement system: how barrier impacts, sled tests, and full-vehicle crashes generate acceleration, force, and deformation data, and where uncertainty enters. It then moves to the CAE side: how LS-DYNA or equivalent explicit solvers represent the same event, which modeling choices (mesh size, material cards, contact definitions, hourglass control) most strongly influence correlation. From there, the course develops the analytical core — time-history alignment, correlation metrics, sensitivity analysis, and calibration — and extends into learning-based methods such as surrogate models, Gaussian processes, and neural networks that can map model parameters to discrepancy patterns. Finally, it addresses how validated models are used for regulatory compliance, design decisions, and safety margin assessment.
Why Discrepancy Analysis Matters
A CAE model that has not been correlated against physical testing is a hypothesis, not evidence. Regulatory frameworks such as FMVSS 208, Euro NCAP, and C-NCAP accept simulation only when the model has demonstrated validated correlation with test data. Beyond compliance, discrepancy analysis directly affects design cost: an over-stiff model may drive unnecessary mass into a structure, while an over-soft model may hide a real injury risk. The economic and ethical stakes are both high.
Discrepancy arises from multiple sources that must be separated before they can be reduced. The most common categories are:
- Test-side uncertainty: sensor placement, filtering (SAE J211 CFC 60/180/600), trigger timing, fixture compliance, and specimen-to-specimen variation.
- Modeling idealization: geometry simplification, element size, spot-weld and adhesive representation, and material constitutive laws.
- Parameter uncertainty: strain-rate-dependent yield, failure strain, friction coefficients, and preload conditions.
- Numerical effects: time-step size, hourglass energy, contact stiffness, and mass scaling.
Learning-based methods enter precisely because these sources interact nonlinearly. A purely manual trial-and-error calibration cannot efficiently explore a high-dimensional parameter space. Surrogate-assisted optimization and machine-learning classifiers can rank parameter influence, predict discrepancy magnitude, and propose calibration directions — but only when the underlying physical data is trustworthy.
Learning Objectives
By the end of this course, you should be able to:
- Explain the sources of test–CAE discrepancy and classify them as aleatory or epistemic.
- Process and align physical test signals with simulation output using standard filtering and time-shift methods.
- Compute and interpret correlation metrics such as CORA, peak force error, and energy absorption deviation.
- Build and run a sensitivity study to identify the parameters that dominate discrepancy.
- Apply surrogate modeling and learning-based calibration to reduce discrepancy efficiently.
- Document a validated model with traceable evidence suitable for regulatory or internal review.
The Discrepancy Analysis Workflow at a Glance
The diagram below shows how physical test data and CAE predictions converge through a structured comparison and calibration loop. It is not a linear checklist; the feedback path from validation back to model setup is where most engineering effort is spent.
How the Course Is Organized
The 30 chapters follow a deliberate progression. Early chapters establish the measurement and modeling foundations: test instrumentation, signal processing, FE model construction, and the mathematical definition of discrepancy. Middle chapters develop the analytical toolkit — correlation metrics, sensitivity analysis, surrogate modeling, and optimization-based calibration. Later chapters apply these methods to real subsystems: frontal barriers, side impacts, pedestrian protection, and occupant restraint systems. The final chapters address documentation, regulatory submission, and the emerging role of machine learning in continuous model improvement.
Each chapter is built around a reproducible engineering task. Where a calculation, parameter set, or comparison method is introduced, it is presented with concrete inputs and observable outputs so that you can reproduce the reasoning on your own models. Example values are clearly identified as illustrative; they are not presented as measured results from a specific vehicle program.
Key Terminology Used Throughout
| Term | Meaning in This Course |
|---|---|
| Discrepancy | Quantified difference between physical test response and CAE prediction for the same event and measurement location. |
| Correlation | Degree to which two time histories or scalar responses agree, expressed through metrics such as CORA or peak error. |
| Calibration | Adjustment of model parameters within physically justified bounds to reduce discrepancy. |
| Validation | Demonstration that a calibrated model predicts independent test conditions within an accepted tolerance. |
| Surrogate model | A fast mathematical approximation (e.g., Gaussian process, polynomial response surface) trained on simulation outputs. |
| Aleatory uncertainty | Irreducible variability, such as specimen-to-specimen material scatter. |
| Epistemic uncertainty | Reducible uncertainty due to incomplete knowledge, such as an unknown friction coefficient. |
With this foundation in place, the next chapter begins with the physical test itself — how crash events are measured, what the sensors actually record, and why the raw signal is never the final data used for comparison.