1. Course overview
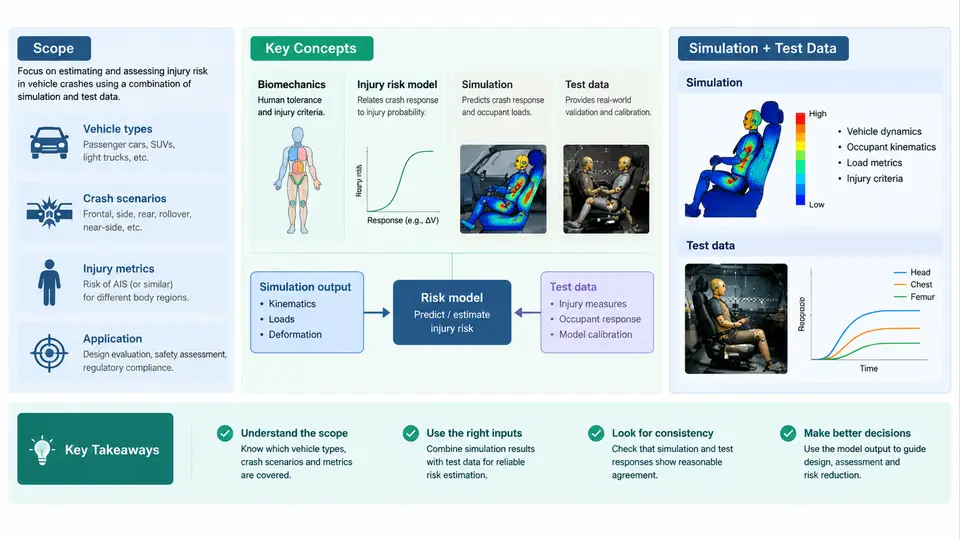
Crash injury risk modeling is the discipline of estimating the probability and severity of occupant, pedestrian, or vulnerable road user injury under a defined crash scenario. It sits at the intersection of vehicle structural mechanics, biomechanics, statistics, and data engineering. This course treats injury risk modeling as an engineering workflow rather than a single technique: physical tests generate ground truth, simulation extends that truth to untested conditions, and statistical models convert both into probabilities that support design decisions, regulation, and safety rating programs.
What "Injury Risk" Actually Means
An injury risk model does not predict whether a specific person will be injured. It estimates the likelihood that a defined population, exposed to a defined loading condition, exceeds a defined injury threshold. Three elements must therefore always be explicit:
- Injury metric and threshold — for example HIC15 > 700 for head injury, or chest deflection > 63 mm for rib fracture risk under a given criterion.
- Loading or exposure variable — delta-v, peak acceleration, belt force, airbag pressure, intrusion, or a full time-history.
- Population and boundary conditions — occupant size (5th percentile female to 95th percentile male), seating position, restraint state, impact mode, and impact angle.
Risk is normally expressed as a probability curve rather than a single number. A typical form is a cumulative distribution function such as a logistic or Weibull relation between a response variable x and injury probability P:
P(injury | x) = 1 / (1 + exp(-(beta0 + beta1 * x)))

Example (illustrative, not measured data):
  beta0 = -9.20, beta1 = 0.0125, x = HIC15
  x = 700  ->  P = 1 / (1 + exp(-(-9.20 + 8.75))) = 0.39
  x = 1000 ->  P = 1 / (1 + exp(-(-9.20 + 12.50))) = 0.96
The coefficients above are illustrative only. Real coefficients come from paired test data, reconstructions, or meta-analyses, and they carry confidence intervals that matter as much as the point estimate.
Why Both Simulation and Test Data Are Required
Physical crash tests are the anchor of the field. A sled test or full-scale barrier test produces measured accelerations, forces, and deformations on an Anthropomorphic Test Device (ATD) or post-mortem human surrogate (PMHS). These measurements are traceable, repeatable within known tolerances, and accepted by regulators. Their limitation is coverage: each test is expensive, and the space of occupant sizes, impact speeds, angles, and restraint configurations is enormous.
Simulation closes that gap. A validated finite element (FE) or lumped-parameter model can be run thousands of times across a design-of-experiments matrix, producing response distributions where testing alone could only produce a handful of points. The critical constraint is validation: a simulation is only as credible as the evidence that it reproduces the physical response it claims to represent.
The End-to-End Modeling Chain
The diagram below shows how the three data sources and the modeling stages connect. Note that validation is a feedback path, not a one-time gate — when a model fails correlation, the loop returns to model setup rather than proceeding to risk estimation.
Key Concepts You Will Use Throughout the Course
| Concept | Definition | Typical Role |
|---|---|---|
| Injury Assessment Reference Value (IARV) | Response threshold above which injury is considered likely for a given body region | Defines the pass/fail boundary in criteria |
| ATD (Anthropomorphic Test Device) | Instrumented physical surrogate (e.g., Hybrid III, THOR, WorldSID) | Produces repeatable measured response in tests |
| PMHS | Post-mortem human surrogate used for biofidelity data | Provides injury-level ground truth |
| CORrelation factor (CORA) | Objective scalar comparing simulated and measured curves | Quantifies validation quality |
| Design of Experiments (DOE) | Structured matrix of simulation input combinations | Efficiently samples the response space |
| Injury risk curve | Probability function mapping response to injury likelihood | Converts deterministic outputs into risk |
How the Workflow Runs in Practice
Consider a side-impact occupant protection study. The team begins with a set of WorldSID sled tests at three impact speeds and two seat positions. Each test yields time histories for pelvis acceleration, chest deflection, and head acceleration. These become the validation targets.
The FE occupant model is then set up with the same boundary conditions. After a baseline run, the team compares simulated and measured curves. If chest deflection peaks at 48 mm in simulation versus 55 mm in test, the difference exceeds the tolerance band and the model requires adjustment — commonly in belt stiffness, contact friction, or material card parameters. Only after the model passes correlation at all validation points does it proceed to the DOE sweep.
The DOE might vary impact speed from 20 to 40 km/h, impact angle from 60° to 90°, and belt pretensioner force across three levels. Each run outputs the injury metrics of interest. The resulting dataset — hundreds of input/output pairs — feeds the statistical risk model, which produces probability curves for each body region.
What This Course Covers
The remaining chapters build this workflow in sequence. You will work through test data acquisition and signal processing, ATD and PMHS response interpretation, FE and lumped-parameter model construction, objective validation methods, DOE design, statistical injury risk fitting, uncertainty quantification, and finally the application of risk models to design decisions and regulatory assessment. Each stage is treated as an engineering task with defined inputs, observable intermediate results, and explicit acceptance criteria.
By the end, you should be able to take a crash scenario, assemble the appropriate test and simulation evidence, build and validate a model, and produce a defensible injury risk estimate — including a clear statement of its limitations.