1. Vehicle crashworthiness design fundament
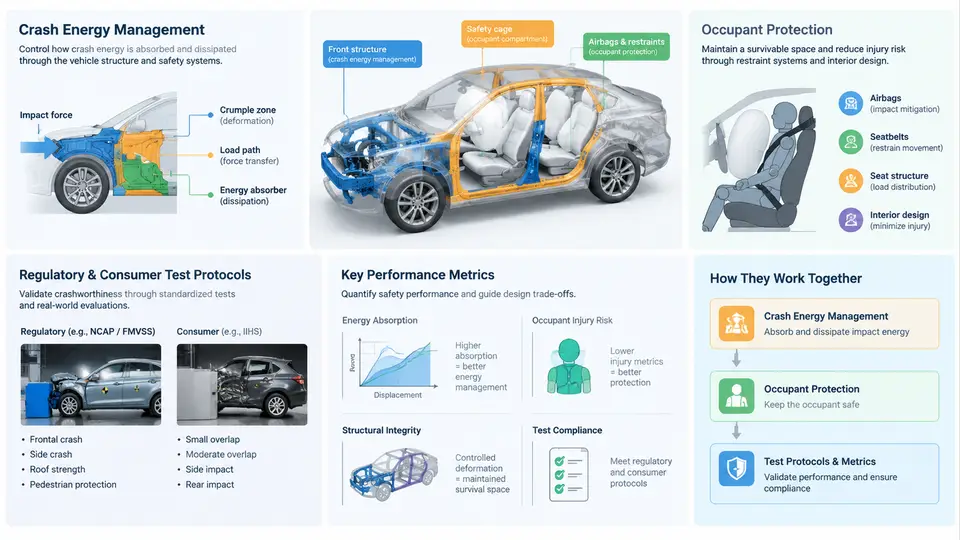
Crashworthiness is the ability of a vehicle structure to protect occupants and other road users during a collision. It is not the same as crash avoidance, which belongs to active safety. Crashworthiness is a passive safety discipline: once a collision is unavoidable, the body-in-white (BIW), restraint systems, and interior surfaces must manage the kinetic energy of the impact so that occupant loads stay within tolerable limits. In practice, engineers describe this through three coupled requirements: manage crash energy, control deceleration and intrusion, and satisfy regulatory and consumer test protocols.
Crash Energy Management
At the start of a frontal impact, a vehicle of mass m travelling at velocity v carries kinetic energy E = ½mv². For a 1,500 kg vehicle at 56 km/h (15.56 m/s), that is roughly 181 kJ. The structure cannot destroy this energy; it can only convert it into deformation work, heat, and noise over a controlled distance and time. The governing relationship is that the average crash force F multiplied by the crush distance s must absorb the energy: F·s ≈ ½mv². This immediately reveals the central trade-off: a longer crush distance lowers the average force and therefore the deceleration experienced by occupants, but packaging, styling, and powertrain layout limit how much length is available.
Energy management is achieved through a deliberate sequence of structural events. The front longitudinal rails and crash boxes are designed to fold in a stable, progressive manner, producing a controlled force plateau rather than a single peak. A common design target is a rail force plateau of roughly 150–250 kN per side for a mid-size passenger car, with a peak-to-mean force ratio kept as low as possible. The bumper beam and crash box initiate the fold; the rail then continues the crush; the firewall and dash panel act as the final barrier that limits intrusion into the occupant compartment.
Two concepts are essential here. First, progressive collapse: the structure must deform in a predictable order, from the front toward the occupant cell, so that energy is absorbed before it reaches the occupants. Second, compatibility: a stiff, heavy vehicle must not simply push a lighter vehicle out of the way; it should engage its own crush structure so that both vehicles share the energy. This is why modern front-end designs include lower load paths and bumper height alignment features.
Occupant Protection and Load Paths
Once the structure has absorbed as much energy as packaging allows, the remaining deceleration is transmitted to the occupant through the restraint system. The occupant compartment must remain a survivable space: the steering column, pedals, and toe pan must not intrude excessively, and the seats and belts must keep the occupant in the correct position. The load path concept is central. In a frontal impact, loads travel from the bumper beam into the crash boxes, along the longitudinal rails, into the rocker panels and floor, and finally into the rear structure. In a side impact, loads enter through the door beam, B-pillar, rocker, and floor cross-members. A well-designed body has multiple redundant load paths so that a single failed member does not cause catastrophic intrusion.
Occupant protection metrics are usually expressed in terms of injury criteria. The most common are the Head Injury Criterion (HIC), chest deflection and chest acceleration (3 ms clip), femur loads, and neck injury criteria such as Nij. These are measured with instrumented Anthropomorphic Test Devices (ATDs), commonly called crash test dummies, and increasingly with human body models in simulation.
Regulatory and Consumer Test Protocols
Crashworthiness is verified against two families of tests. Regulatory tests define the legal minimum; consumer tests, such as those run by Euro NCAP, NHTSA, and IIHS, are more demanding and influence market perception. The table below summarizes the most common frontal and side configurations.
| Protocol | Configuration | Typical speed | Primary focus |
|---|---|---|---|
| FMVSS 208 | Full frontal rigid barrier | 56 km/h | Restraint performance, HIC, chest |
| ECE R94 / UN R94 | 40% offset deformable barrier | 56 km/h | Structural intrusion, occupant loads |
| Euro NCAP frontal | 50% offset deformable barrier | 50 km/h | Intrusion, restraint, compatibility |
| IIHS moderate overlap | 40% offset deformable barrier | 64 km/h | Occupant compartment integrity |
| FMVSS 214 / Euro NCAP side | Moving deformable barrier | 50–60 km/h | Side intrusion, pelvis and thorax |
Each protocol specifies barrier geometry, impact angle, dummy type, and pass/fail thresholds. For example, a common HIC limit is 1,000 for a 15 ms window, and chest deflection is often limited to around 50 mm for a 50th-percentile male dummy. These thresholds are not arbitrary; they are derived from injury risk curves and are updated as data accumulates.
Key Performance Metrics and Their Relationships
The metrics are not independent. Increasing rail force raises energy absorption but also raises occupant deceleration. Increasing crush distance lowers deceleration but may conflict with styling and packaging. Adding a stiff B-pillar improves side intrusion but can increase chest loading if the door trim is not tuned. This is why crashworthiness design is inherently a multi-objective optimization problem, and why Bayesian optimization is a natural fit: the objective functions are expensive to evaluate, noisy, and often conflicting.
The schematic above shows the two coupled domains. On the left, the barrier delivers kinetic energy into the crash boxes and rails, which convert it into plastic deformation. The force–displacement curve below illustrates the ideal shape: a controlled initial peak followed by a stable plateau, then a rise as the firewall and occupant cell resist further intrusion. A poorly tuned design shows a very high initial peak (high occupant deceleration) or a collapsing plateau (insufficient energy absorption and excessive intrusion).
From Fundamentals to Optimization
Every quantity in this chapter—rail force, crush distance, HIC, chest deflection, intrusion—is a candidate design objective or constraint. In a real program, a single full-vehicle finite element model may take hours to run, and a design study may involve dozens of thickness, material, and geometry variables. This is precisely the setting where Bayesian optimization becomes valuable: it builds a probabilistic surrogate of the crash response and selects the next simulation point to maximize expected improvement, rather than relying on exhaustive sampling. The fundamentals covered here define the objective space that the optimizer will explore.