1. Airbag fabric and seam failure modeling
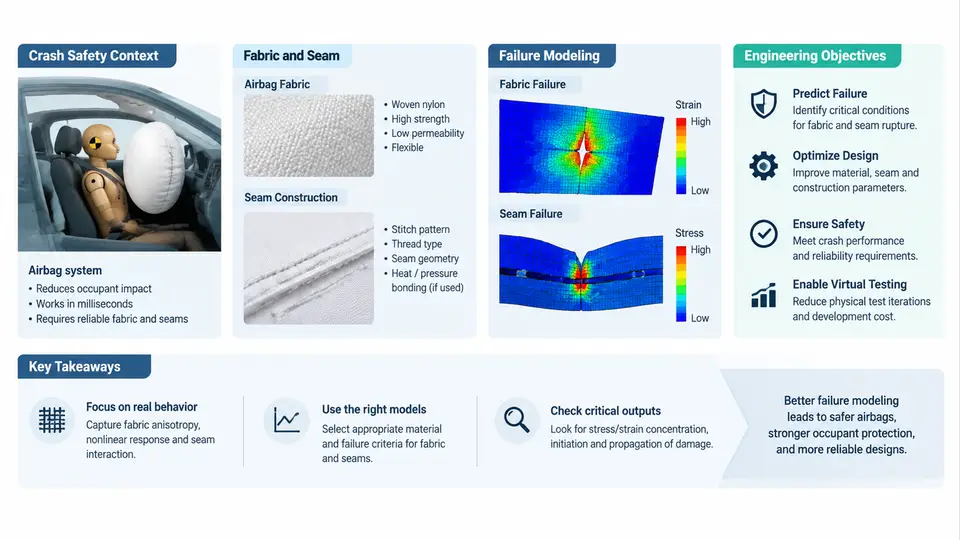
An airbag is a pressure vessel that exists for roughly 30 to 100 milliseconds. It is manufactured from woven textile, joined by stitched seams, folded into a compact module, and then loaded by a pyrotechnic inflator that can raise internal pressure from ambient to several hundred kilopascals in under 20 ms. If the fabric or a seam ruptures during that window, the restraint system does not merely lose efficiency — it can release a high-velocity jet of hot gas and fabric fragments into the occupant compartment. This course treats that failure mode as a modeling problem: how do we predict, before a single physical test is run, where a woven airbag will tear, when a seam will unzip, and how much energy the structure can absorb before it does?
Why fabric and seams dominate airbag reliability
Airbag engineering is often taught as an inflator problem — gas generation, mass flow, burn rate. In practice, the inflator defines the load, while the fabric and seam architecture define the capacity to carry that load. The two are coupled, and the coupling is where failures concentrate. Three characteristics make textile structures unusually difficult to model:
- Anisotropy and crimp interchange. A woven nylon 6.6 fabric has different stiffness along warp and weft, and the yarns exchange crimp as the fabric extends. The initial modulus is low, then rises sharply as yarns straighten — a nonlinear, S-shaped stress–strain response that no single elastic constant captures.
- Coating and permeability. Silicone or neoprene coatings control leakage. Permeability changes with pressure, temperature, and strain, so the internal pressure field is not uniform and evolves during deployment.
- Seam behavior is discrete, not continuous. A seam is a row of stitch points. Load transfer happens at discrete locations, and failure typically initiates at the seam edge, at a stitch hole, or at a stress concentration where the seam terminates.
Because of these characteristics, a model that treats the cushion as an isotropic membrane with a single failure stress will systematically mispredict both the location and the timing of rupture. The engineering objective of this course is to build models that resolve the mechanisms, not just the global response.
Crash safety context: what the airbag must accomplish
Regulatory and consumer-test environments define the performance envelope. FMVSS 208 in the United States, ECE R94 and R95 in Europe, and consumer programs such as US NCAP and Euro NCAP impose occupant injury criteria — HIC, chest deflection, femur load — measured on instrumented dummies. The airbag's contribution is to manage occupant deceleration by distributing restraint force over the torso and head, and to do so within a tightly bounded time window.
Two deployment regimes matter for fabric and seam design:
| Regime | Typical internal pressure | Dominant fabric/seam demand | Typical failure symptom |
|---|---|---|---|
| Out-of-position (OOP) deployment | High, localized, early | Burst strength at the throat and seam edges | Seam rupture near the inflator, fabric tear at the retainer |
| In-position restraint | Moderate, distributed | Membrane stress, seam shear, venting control | Vent orifice elongation, progressive seam unzipping |
The OOP case is the more severe structural test. When the occupant is close to the module at deployment, the cushion cannot expand freely; internal pressure spikes, and the fabric and seams near the inflator throat see the highest loads. This is the regime where predictive modeling has the greatest safety value, because physical OOP testing is expensive and destructive.
What "failure modeling" means in this course
Failure modeling here is not a single simulation. It is a chain of representations, each with its own inputs and validation evidence. The figure below shows the chain and the coupling between its stages.
Each stage has a distinct validation path. Material characterization is validated by coupon testing — strip tensile per ASTM D5035, biaxial testing on a cruciform specimen, and permeability measurement across a pressure range. Seam architecture is validated by seam shear and seam peel coupons. The cushion model is validated at the component level by tank burst tests and at the system level by sled or OOP deployment tests. A model is only as trustworthy as the weakest link in this chain.
Engineering objectives and the questions this course answers
By the end of the course, you should be able to answer four concrete engineering questions with quantitative evidence:
- Where will the cushion fail first? Given a cushion geometry, seam layout, and inflator mass-flow curve, predict the location of initial rupture and the time of rupture relative to the deployment timeline.
- How much margin does a seam have? Compute the seam load per unit length at peak pressure and compare it to the measured seam shear strength, including a stress concentration factor for the seam termination.
- How sensitive is the result to material scatter? Airbag fabric properties vary lot to lot. Quantify how variation in tensile strength and permeability propagates to rupture time and pressure.
- What design change fixes a failure? Translate a predicted failure into a specific change — stitch density, seam allowance, coating weight, vent area — and predict the effect before building a prototype.
A worked example of the modeling logic
Consider a driver-side cushion with a 60 L inflated volume, a fabric areal density of 235 g/m², and a seam allowance of 10 mm with a double-row lockstitch at 6 stitches per 25 mm. Suppose the inflator delivers a peak mass flow of 2.5 kg/s of gas at 900 K, and the cushion reaches a peak internal pressure of 250 kPa in an OOP scenario.
The membrane stress in a spherical approximation is:
sigma = (p * r) / (2 * t)

where:
  p = internal pressure        = 250,000 Pa
  r = effective cushion radius = 0.24 m  (from 60 L volume)
  t = fabric thickness         = 0.00035 m

sigma = (250000 * 0.24) / (2 * 0.00035)
      = 60000 / 0.0007
      = 85.7 MPa
If the fabric's ultimate tensile strength is 120 MPa, the membrane margin is 1.4 — apparently safe. But the seam is the weak point. The load per unit length along the seam is:
N = p * r / 2 = 250000 * 0.24 / 2 = 30,000 N/m = 30 N/mmIf the measured seam shear strength is 35 N/mm, the seam margin is only 1.17. Apply a stress concentration factor of 1.3 at the seam termination — a typical value for a lockstitch run ending at a corner — and the effective demand becomes 39 N/mm, which exceeds the seam strength. The model predicts seam rupture at the termination, not fabric rupture in the membrane. This is exactly the kind of result that changes a design: the fix is not a heavier fabric but a seam termination detail, such as a backstitch or a reinforced patch.
How the course is organized
The remaining chapters build this chain from the bottom up. We begin with woven fabric mechanics and the constitutive models that capture crimp interchange and biaxial behavior. We then move to seam mechanics — stitch types, load transfer, and progressive failure. With those foundations, we construct the cushion model: shell meshing, seam element representation, folding, and contact. We then apply inflator load curves and solve the coupled pressure–structure problem. Finally, we address validation, sensitivity analysis, and design iteration. Throughout, the emphasis is on inputs you can measure, calculations you can reproduce, and outputs you can compare against physical test evidence.