1. Qualification context and scope
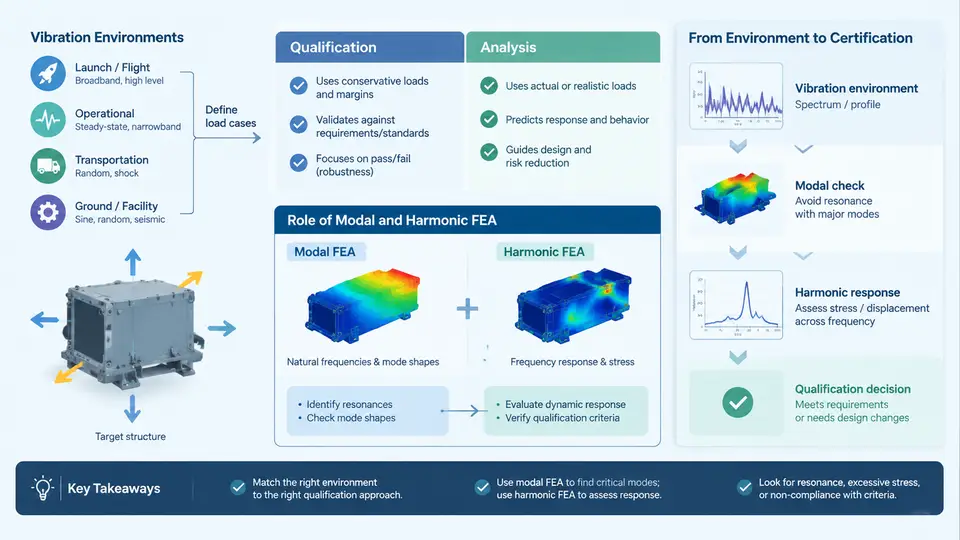
Structural vibration qualification is the process of demonstrating, with acceptable evidence, that a structure will survive and continue to function in the vibration environment it will actually experience. In aerospace, automotive, rail, and industrial equipment programs, this evidence is usually assembled from three sources: physical testing, analysis, and similarity or heritage arguments. Modal and harmonic finite element analysis (FEA) sit at the center of the analytical path because they answer two questions that dominate every vibration qualification: where does the structure want to vibrate, and how strongly does it respond when the environment pushes at those frequencies?
This chapter establishes the vocabulary and the decision framework used throughout the course. It defines what a vibration environment is, distinguishes qualification from analysis as evidence types, and explains precisely what modal and harmonic FEA contribute to a certification argument — and what they cannot contribute.
What "Vibration Environment" Actually Means
A vibration environment is not a single number. It is a specification of excitation as a function of frequency, direction, duration, and statistical character. The most common forms encountered in qualification work are:
- Random vibration — defined by a power spectral density (PSD) in g²/Hz over a frequency band, with an overall root-mean-square (GRMS) level and a duration. Typical of launch vehicles, jet engine mounting, and road-induced excitation.
- Sinusoidal (sine) vibration — defined by amplitude (displacement, velocity, or acceleration) versus frequency, swept at a specified rate. Used for rotating machinery, engine order tracking, and resonance searches.
- Sine-on-random and random-on-random — superimposed narrowband tones on a broadband floor, common on rotorcraft and tracked vehicles.
- Transient and shock — pyroshock, drop, and impact events, usually specified as a shock response spectrum (SRS).
Each environment type maps to a different analysis method. Random vibration is normally handled with a PSD input and a Miles' equation or full spectral response calculation. Sine sweep is handled with a harmonic (frequency-response) analysis. Shock is handled with transient or SRS-based methods. This course focuses on the modal and harmonic toolset, which underpins the first two.
Qualification vs. Analysis: Two Different Kinds of Evidence
Qualification testing applies the specified environment to the actual article, or a dedicated qualification unit, at levels and durations defined by the program. It produces direct, incontrovertible evidence: the unit either survives and passes functional checks, or it does not. Its weaknesses are cost, schedule, and the fact that it can only be performed once the hardware exists.
Analysis produces predictive evidence. It can be performed before hardware exists, it can be repeated cheaply for design trades, and it can cover conditions that are impractical to test. Its weakness is that it is only as good as its inputs — mass, stiffness, damping, boundary conditions, and the environment specification itself.
In practice, qualification is a combined argument. Analysis is used to:
- Predict responses and identify critical locations before test, so instrumentation is placed where it matters.
- Extrapolate test results to flight configurations, different boundary conditions, or higher levels.
- Demonstrate margin where testing is impossible or where the test article is not fully representative.
- Support a "test-plus-analysis" or "analysis-only" qualification path when the program permits it.
The Role of Modal Analysis
Modal analysis solves the undamped (or lightly damped) eigenvalue problem:
[K] {φ} = ω² [M] {φ}where [K] is the stiffness matrix, [M] is the mass matrix, ω is the natural frequency in rad/s, and {φ} is the mode shape. The output is a set of natural frequencies and corresponding mode shapes. In a qualification context, modal analysis answers:
- Where are the resonances? If a natural frequency falls inside the excitation band, the structure will amplify the input at that frequency.
- What does the mode look like? Mode shape tells you which locations move most, which is where you place accelerometers and where you expect high stress.
- How does the structure couple to the input? A mode that does not participate in the excitation direction will not be strongly excited, regardless of its frequency.
Modal analysis alone does not give response amplitudes. It gives the frequencies and shapes that govern the response. This distinction is critical: a modal run that shows a resonance at 120 Hz tells you the structure can amplify at 120 Hz, but not by how much.
The Role of Harmonic Analysis
Harmonic (frequency-response) analysis applies a sinusoidal input at each frequency in a sweep and solves the forced response:
(-ω² [M] + jω [C] + [K]) {X(ω)} = {F(ω)}where [C] is the damping matrix and {X(ω)} is the complex displacement response. The output is response amplitude and phase versus frequency at every requested location. This is what converts a modal result into a quantitative prediction: at 120 Hz, with 2% critical damping and a given input level, the response at the critical location is X g, and the resulting stress is Y MPa.
Harmonic analysis is the natural bridge to random vibration. Once the frequency response function (FRF) is known, the response PSD is obtained by multiplying the input PSD by the squared magnitude of the FRF. This is why a well-executed harmonic analysis is often the most valuable single analysis in a vibration qualification package.
How the Pieces Fit Together
The diagram below shows the relationship between the environment specification, the two analysis types, and the qualification evidence they support.
Scope Boundaries: What This Course Covers and What It Does Not
This course covers the analytical path: building a modal model, validating it, running harmonic and random response analyses, and interpreting the results for qualification. It assumes the environment specification already exists and is correct. It does not cover:
- Derivation of the vibration environment from mission profiles or measured flight data.
- Test fixture design, shaker selection, or control system tuning.
- Fatigue life calculation beyond the response PSD stage.
- Nonlinear effects such as gaps, friction damping, or large-deflection behavior, except where they invalidate a linear assumption.
These boundaries matter because a common failure mode in qualification programs is applying linear modal and harmonic methods to a structure that is significantly nonlinear, or using a linear model to extrapolate far beyond the validated range. Knowing the scope of validity is part of knowing the method.
Key Definitions Used Throughout
| Term | Definition | Typical Unit |
|---|---|---|
| Natural frequency (fₙ) | Frequency at which a mode responds with maximum amplification | Hz |
| Mode shape (φ) | Relative displacement pattern of a mode, normalized arbitrarily | dimensionless |
| Damping ratio (ζ) | Energy dissipation relative to critical damping | % critical |
| FRF / H(f) | Complex ratio of response to input at a given frequency | g/g or g/lbf |
| PSD | Power spectral density of a random signal | g²/Hz |
| GRMS | Root-mean-square acceleration of a random environment | g |
| Q (amplification factor) | Approximately 1/(2ζ) at resonance | dimensionless |
Why This Order Matters
The course follows the sequence modal → harmonic → random because that is the order in which the physics builds. A modal run that misses a mode will produce a harmonic response that misses a peak, which will produce a random response that underestimates GRMS and fatigue damage. Errors propagate forward. The early chapters therefore emphasize model validation and mode identification before any response calculation is attempted.
By the end of this course, you should be able to take a CAD assembly and an environment specification, build and validate a modal model, run a harmonic sweep, convert the result to a random response, and present the whole chain as defensible qualification evidence.