1. Fatigue and durability CAE in product de
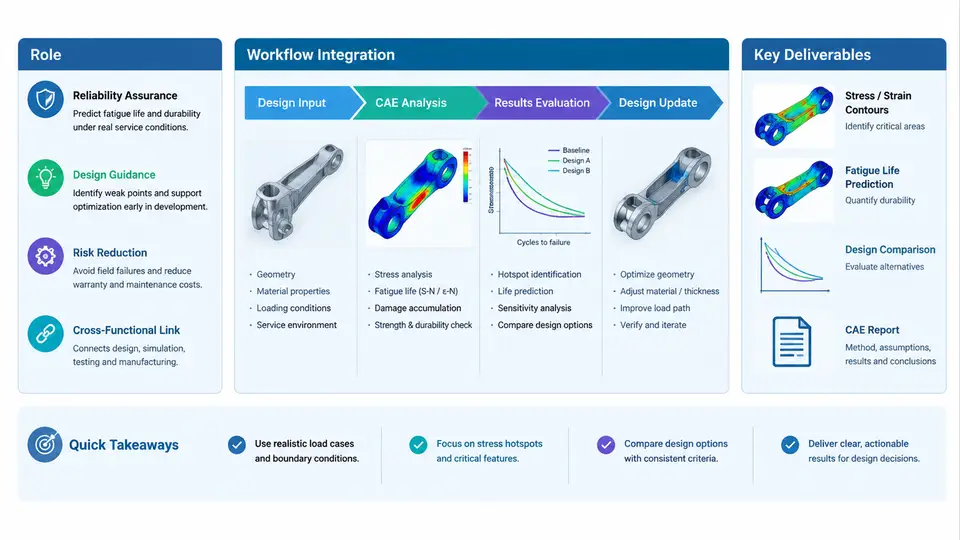
Fatigue and durability CAE occupies a specific and often misunderstood position in the product development cycle. It is not simply "stress analysis with more cycles," nor is it a final validation checkbox performed after the design is frozen. Its real value emerges when it is treated as a decision-support discipline that runs concurrently with design, providing quantitative guidance on where cracks will initiate, how long a structure will survive, and which design changes will produce the greatest durability benefit at the lowest cost.
This chapter establishes the conceptual and procedural foundation for the entire course. It defines what fatigue and durability CAE actually delivers, how it integrates into a staged product development process, and what concrete artifacts a durability engineer is expected to produce at each stage.
What Fatigue and Durability CAE Actually Solves
Static strength analysis answers a single question: will the structure survive the maximum load? Fatigue analysis answers a fundamentally different question: will the structure survive the accumulated damage from millions of smaller, repeated loads over its intended service life? These are not the same problem, and a design that passes static checks can still fail catastrophically in service due to fatigue.
The core computational chain in fatigue CAE consists of four linked stages:
- Load characterization — converting service conditions into a load-time history or a statistical load spectrum.
- Structural response — computing stress or strain histories at critical locations using FEA, often with modal superposition or transient solvers.
- Fatigue damage accumulation — applying a fatigue model (stress-life, strain-life, or crack growth) to convert stress cycles into damage.
- Life prediction and margin assessment — comparing predicted life against target life and quantifying the safety factor.
Each stage introduces uncertainty. The durability engineer's job is not to eliminate uncertainty but to quantify it, propagate it through the chain, and communicate the resulting risk in terms the design team can act on.
Workflow Integration Across Development Stages
Fatigue CAE delivers different value at different stages of product development. Attempting to perform detailed fatigue analysis too early wastes effort on immature geometry; performing it too late leaves no room for design change. The following table summarizes the typical integration pattern.
| Development Stage | Durability CAE Activity | Primary Output | Decision Supported |
|---|---|---|---|
| Concept / architecture | Load path screening, material selection, simplified life estimates | Durability risk map, material candidates | Architecture trade-off |
| Preliminary design | Global FE model with nominal loads, hotspot identification | Critical location list, preliminary life estimates | Geometry concept selection |
| Detailed design | Refined mesh, local stress/strain analysis, load spectrum definition | Predicted life at hotspots, sensitivity ranking | Design refinement, thickness/radius changes |
| Design verification | Full fatigue assessment with statistical factors, weld classification | Durability report, safety margins | Design freeze approval |
| Validation support | Correlation with physical test, model calibration | Updated model, correlation report | Test sign-off, model reuse |
The critical insight is that durability CAE is not a single event but a continuous thread. Each stage refines the previous stage's estimate, and the confidence in the prediction increases as geometry, loads, and material data mature.
Key Deliverables and Their Engineering Content
A durability CAE deliverable is not a screenshot of a contour plot. It is a structured argument that connects assumptions to conclusions. The following deliverables represent the minimum professional standard.
1. Durability Analysis Plan. This document defines the scope, the fatigue methodology (e.g., nominal stress approach per IIW recommendations, local strain approach per E-N curves, or fracture mechanics per Paris' law), the load cases and spectra, the material data sources, and the acceptance criteria. It is written before analysis begins and agreed upon with the design and test teams.
2. Load Spectrum Definition. For a suspension control arm, for example, this might be a rainflow-counted histogram derived from proving ground measurements, expressed as a matrix of cycle ranges and means. The spectrum must state its basis: 10,000 km of mixed road, 95th percentile customer usage, or a specific proving ground schedule.
3. Fatigue Life Prediction Report. This contains the FE model description, boundary conditions, stress/strain results at critical locations, damage summation (Miner's rule or equivalent), and the predicted life with confidence intervals. A typical statement might read: "At the lower control arm ball joint boss, predicted life is 2.3 × 10⁵ cycles under the defined spectrum, corresponding to approximately 180,000 km. Target life is 150,000 km. Margin factor = 1.2."
4. Sensitivity and Optimization Summary. This ranks design parameters by their influence on fatigue life. For example: fillet radius at the boss (dominant), material grade (moderate), wall thickness (low). This directly guides the design team's change priorities.
5. Correlation Report. After physical testing, this document compares predicted versus measured life, identifies sources of discrepancy (load measurement error, material property scatter, weld quality), and recommends model updates.
Visualizing the Integration and Data Flow
The following diagram shows how durability CAE connects to the broader development workflow, including the key inputs, the analysis chain, and the feedback loops to design and test.
Practical Example: Durability Assessment of a Welded Bracket
Consider a welded steel bracket used to mount an exhaust system to a vehicle body. The bracket experiences road-induced vibration and thermal cycling. A durability CAE assessment proceeds as follows.
Inputs: The bracket geometry is a 3 mm thick stamped steel plate welded to a 2 mm body panel. Material is S355MC with a yield strength of 355 MPa. The load spectrum is derived from a 10,000 km proving ground schedule, rainflow-counted into 20 bins with a maximum stress range of 180 MPa at the weld toe.
Analysis: A shell FE model with 5 mm mesh is created. The weld is represented by rigid elements connecting the bracket to the panel. A modal frequency response analysis computes the stress history at the weld toe. The nominal stress approach per IIW recommendations is applied, using FAT 80 for the fillet weld detail. The damage sum is calculated using Miner's rule with a slope of m = 3.
Result: The predicted life at the weld toe is 4.2 × 10⁵ cycles, corresponding to approximately 85,000 km. The target life is 150,000 km. The margin factor is 0.57, indicating a durability shortfall.
Action: Sensitivity analysis shows that increasing the bracket thickness from 3 mm to 4 mm reduces stress at the weld toe by 18%, raising predicted life to 1.6 × 10⁶ cycles (approximately 320,000 km). The design team adopts the thicker bracket, and a re-analysis confirms the margin factor improves to 2.1.
Common Pitfalls and How to Avoid Them
- Using static safety factors for fatigue. A static safety factor of 2.0 does not imply a fatigue safety factor of 2.0. Fatigue margins must be computed from the fatigue model.
- Ignoring load spectrum uncertainty. The load spectrum is often the largest source of error. Always document its basis and perform sensitivity analysis on load magnitude.
- Neglecting weld classification. Welded joints require specific fatigue detail categories (e.g., FAT classes per IIW or Eurocode). Using base material S-N curves for welds is a serious error.
- Treating mean stress as zero. Mean stress significantly affects fatigue life. Use a mean stress correction (Goodman, Gerber, or Morrow) appropriate to the material and loading.
- Failing to correlate with test. Without correlation, the model remains unvalidated. Plan for test correlation from the beginning.
This chapter has established the role of fatigue and durability CAE as a decision-support discipline, described its integration across development stages, and defined the key deliverables that make its results actionable. The following chapters will examine each element of the analysis chain in detail, beginning with load characterization and spectrum development.