1. Measurement uncertainty in engineering
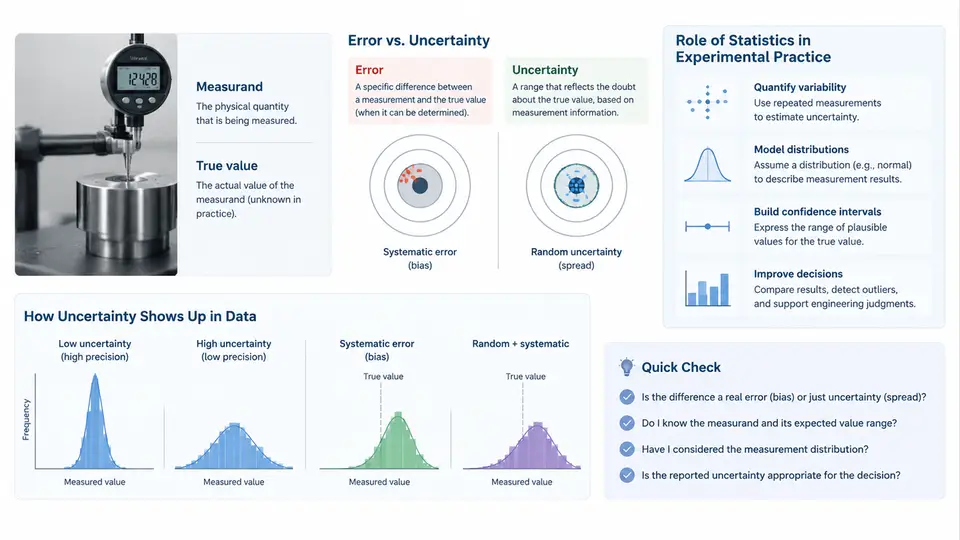
Every engineering measurement ends with a number, and every number carries a hidden question: how much can we trust it? A pressure reading of 2.503 MPa, a shaft diameter of 24.997 mm, a thermocouple output of 312.4 °C — each of these values is the endpoint of a chain of physical interactions, instrument responses, and human decisions. Statistical uncertainty analysis is the discipline that quantifies how much confidence we should place in such numbers, and it begins with a precise vocabulary that separates what we can know from what we can only estimate.
Error and Uncertainty Are Not the Same Thing
In classical metrology, error is defined as the difference between a measured value and the true value of the quantity being measured. If the true temperature of a calibration bath is exactly 100.000 °C and our thermometer reads 100.3 °C, the error is +0.3 °C. This definition is conceptually clean but practically frustrating: if we knew the true value, we would not need to measure it. Error is therefore a theoretical quantity — it exists, but it is never directly observable in real engineering practice.
Uncertainty, by contrast, is a parameter that characterizes the dispersion of values that could reasonably be attributed to the measurand. It is not a claim about how wrong we are; it is a quantified statement about how well we know. A result expressed as 100.3 °C ± 0.4 °C (k = 2) does not say the true value lies within that interval with certainty. It says that, based on the available evidence and the assumed error model, the interval contains the true value with a coverage probability of approximately 95%. This distinction matters enormously in engineering: error is unknowable, but uncertainty is estimable, and it is uncertainty that we report, propagate, and use for decisions.
The Measurand and the Elusive True Value
The measurand is the specific quantity intended to be measured — not the instrument reading, not the sensor output, but the physical quantity itself. This definition sounds trivial until you try to apply it. Consider measuring the diameter of a machined shaft. Is the measurand the diameter at a single cross-section? The average diameter over the full length? The diameter at 20 °C? Each choice defines a different measurand, and each requires a different measurement procedure and uncertainty budget.
The true value of a measurand is the value that would be obtained by a perfect measurement — an idealization that is useful for defining error but never attainable. In practice, metrologists work with a conventional true value, which is a value attributed to a specific material measure or reference standard and accepted, sometimes by convention, as having an uncertainty small enough to be neglected for a given purpose. A calibrated gauge block with a stated length of 50.000 mm and an uncertainty of 0.0001 mm serves as a conventional true value when measuring a workpiece to 0.01 mm tolerance.
This hierarchy — true value, conventional true value, measured value — is not philosophical decoration. It determines what we compare against, how we structure a calibration chain, and where traceability begins. Without a defined measurand and an accepted reference, uncertainty statements are meaningless.
Why Statistics Enters the Picture
If measurement were deterministic, uncertainty analysis would reduce to reading instrument specifications. But real measurements are affected by countless small, independent influences: thermal fluctuations, vibration, electrical noise, operator technique, fixturing repeatability, and the inherent randomness of physical processes. Statistics provides the language to describe these influences collectively.
Two broad categories of uncertainty are recognized in the Guide to the Expression of Uncertainty in Measurement (GUM):
- Type A uncertainty is evaluated by statistical analysis of repeated observations. If we measure the same shaft diameter 10 times and obtain a sample standard deviation of 0.8 µm, that is a Type A contribution.
- Type B uncertainty is evaluated by any other means — manufacturer specifications, calibration certificates, physical models, or engineering judgment. A digital caliper specified as ±0.02 mm over its range contributes Type B uncertainty.
Both types are expressed as standard uncertainties and combined in the same way. The distinction is about how the number was obtained, not about its validity or its probability distribution.
A Worked Example: Measuring Shaft Diameter
Suppose an engineer measures a steel shaft with a digital micrometer. The measurement task is defined as the diameter at mid-length, at a controlled temperature of 20 ± 1 °C. Five repeated readings are taken:
Reading 1: 24.998 mm
Reading 2: 25.001 mm
Reading 3: 24.999 mm
Reading 4: 25.002 mm
Reading 5: 25.000 mm

Mean: 25.000 mm
Sample standard deviation: 0.00158 mm
Standard error of the mean: 0.00158 / √5 = 0.00071 mm
The Type A standard uncertainty from repeatability is 0.00071 mm. The micrometer calibration certificate states an expanded uncertainty of 0.002 mm (k = 2), giving a Type B standard uncertainty of 0.001 mm. A thermal expansion contribution can be estimated from the temperature variation: for steel, α ≈ 11.5 × 10⁻⁶ /°C, so a ±1 °C variation over a 25 mm diameter produces a standard uncertainty of approximately 25 × 11.5 × 10⁻⁶ × 1 / √3 ≈ 0.00017 mm (assuming a rectangular distribution).
Combining these in quadrature:
u_c = √(0.00071² + 0.001² + 0.00017²)
    = √(5.04e-7 + 1.0e-6 + 2.89e-8)
    = √(1.53e-6)
    ≈ 0.00124 mm
The expanded uncertainty at k = 2 is approximately 0.0025 mm. The final result is 25.000 mm ± 0.0025 mm (k = 2). This is a statement about knowledge, not about error. The true diameter may be 24.998 mm or 25.002 mm; the uncertainty interval tells us how confident we are in the measurement process, not what the error actually is.
What Statistics Does and Does Not Do
Statistics cannot eliminate systematic effects. If the micrometer anvil is worn by 0.003 mm, repeated measurements will cluster tightly around a biased mean. The standard deviation will be small, but the result will be wrong. This is why uncertainty analysis must be paired with calibration, traceability, and an honest assessment of systematic contributions. Statistics quantifies random dispersion and provides a framework for combining diverse sources of knowledge; it does not replace physical understanding of the measurement system.
Nor does statistics tell you what decision to make. A measurement of 25.000 mm ± 0.0025 mm against a tolerance of 25.000 ± 0.010 mm suggests the part is acceptable, but the decision rule — simple acceptance, guard-banding, or shared risk — is an engineering and contractual choice. Uncertainty informs the decision; it does not make it.
What This Means for Experimental Practice
In an engineering laboratory, the practical consequences of these definitions are concrete. Before taking data, define the measurand precisely — including environmental conditions, location, and time frame. Identify every significant uncertainty source and classify it as Type A or Type B. Estimate each contribution as a standard uncertainty. Combine them, expand to the desired coverage probability, and report the result with its uncertainty and the coverage factor.
This discipline transforms a bare number into an engineering statement. It allows a designer to compare a measurement against a tolerance with known risk, a metrologist to establish traceability, and a researcher to communicate results that others can reproduce and build upon. The vocabulary of error, uncertainty, true value, and measurand is not academic formalism — it is the foundation on which every credible measurement rests.