1. Foundations of statistical quality contr
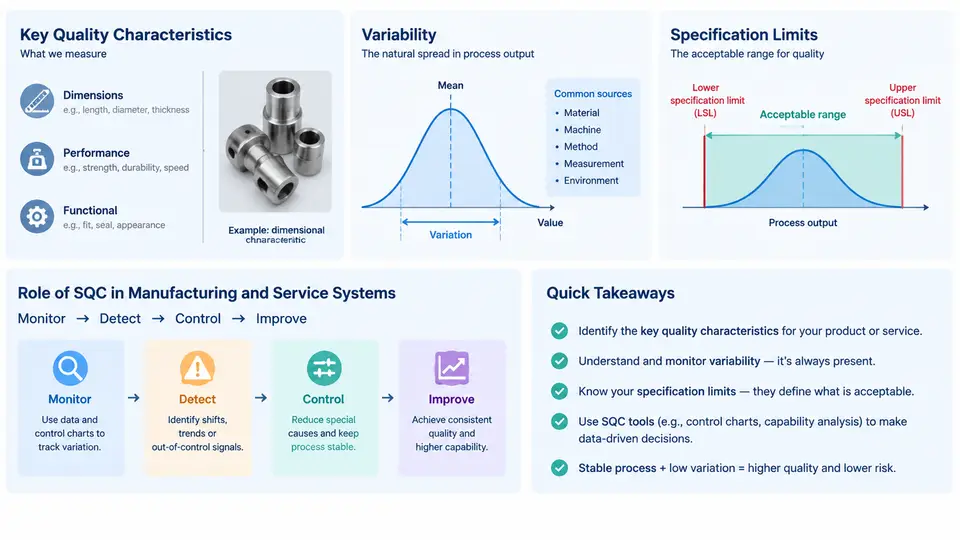
Statistical Quality Control (SQC) is the discipline of using statistical methods to measure, monitor, and improve the quality of products and services. Before any control chart can be plotted or any process capability index computed, practitioners must establish four foundational concepts: what a quality characteristic is, why variability is inevitable, how specification limits differ from control limits, and where SQC fits within a manufacturing or service system. This chapter builds that conceptual base and connects it to a concrete measurement exercise.
Quality Characteristics: Translating Customer Needs into Measurable Variables
A quality characteristic is a measurable property of a product or service that reflects its ability to satisfy requirements. Quality characteristics fall into several categories:
- Variable (continuous) characteristics — measurable on a continuous scale, such as shaft diameter (mm), tensile strength (MPa), fill volume (mL), or service response time (seconds).
- Attribute (discrete) characteristics — counted or classified, such as number of surface defects per panel, pass/fail on a functional test, or proportion of late deliveries.
- Nominal-the-best, smaller-the-better, and larger-the-better — a classification based on the direction of desirability. A bearing bore is nominal-the-best; surface roughness and emissions are smaller-the-better; adhesive bond strength and fuel efficiency are larger-the-better.
Selecting the right characteristic is a design decision, not a statistical one. A poorly chosen characteristic — for example, measuring only the outer diameter of a bushing while ignoring wall thickness — will produce a process that appears capable on paper but fails in assembly. The characteristic must be traceable to a customer requirement, measurable with a defined method, and repeatable across operators and shifts.
Variability: The Central Problem of SQC
No two manufactured parts are identical, and no two service encounters are identical. Variability (also called variation or dispersion) is the observable difference among individual outputs of a process. Walter Shewhart's fundamental insight was that variability is not a single phenomenon but has two distinct components:
- Common-cause variation — the inherent, random variation produced by the process itself. It is stable, predictable, and described by a probability distribution. Reducing it requires fundamental process change.
- Special-cause variation — variation arising from an identifiable, non-random source such as a worn tool, a new operator, a bad batch of raw material, or a temperature excursion. It produces unstable, unpredictable output.
The practical consequence is decisive: a process operating with only common causes is in statistical control and its future behavior can be predicted from its distribution. A process affected by special causes is out of control and cannot be reliably predicted. SQC's first job is to distinguish these two states.
Specification Limits vs. Control Limits
One of the most common sources of confusion in SQC is the distinction between specification limits and control limits. They serve entirely different purposes and originate from entirely different sources.
| Aspect | Specification Limits (USL / LSL) | Control Limits (UCL / LCL) |
|---|---|---|
| Origin | Defined by design, engineering, or the customer | Calculated from process data |
| Purpose | Judge whether a part or service is acceptable | Judge whether the process is stable |
| Applies to | Individual units | Subgroup statistics (means, ranges, proportions) |
| Typical basis | Functional requirements, tolerance stack-up, regulations | ±3 standard deviations of the plotted statistic |
| Change frequency | Rarely, and only through formal change control | Recalculated when the process changes |
A process can be in control yet incapable (all points inside control limits, but many units outside specification limits). Conversely, a process can be out of control yet every unit still conforms — a warning that capability may soon collapse. The two judgments are independent and must both be made.
The Role of SQC in Manufacturing and Service Systems
SQC is not a standalone activity; it is embedded in a larger quality system. Its role can be understood as a feedback loop that connects measurement to action.
The loop works as follows. Inputs enter a process that transforms them into outputs. A defined quality characteristic is measured on those outputs. SQC tools — control charts, capability studies, Pareto analysis — analyze the measurements. If the process is both in control and capable, monitoring continues. If not, the practitioner investigates: a special cause is identified and eliminated, or common-cause variation is reduced through process redesign. The corrective action feeds back to the process, closing the loop.
In service systems, the same loop applies, though characteristics are often attribute-based or time-based. A call center might track average handle time (variable) and first-call resolution rate (attribute). A hospital might monitor medication error rate (attribute) and patient wait time (variable). The statistical machinery is identical; only the characteristic changes.
A Concrete Measurement Exercise
To make these concepts tangible, consider a machining process producing a shaft with a specified diameter of 25.00 mm ± 0.05 mm. The specification limits are therefore USL = 25.05 mm and LSL = 24.95 mm. An operator collects 25 consecutive shafts and measures each with a calibrated micrometer. Suppose the sample mean is 25.01 mm and the sample standard deviation is 0.012 mm.
From these values, the practitioner can compute preliminary control limits for an individuals chart: UCL = 25.01 + 3(0.012) = 25.046 mm and LCL = 25.01 − 3(0.012) = 24.974 mm. Note that the control limits fall inside the specification limits — a favorable sign. If the control limits were wider than the specification limits, the process would be incapable of meeting requirements even when stable.
The next step is to plot the 25 individual measurements against these limits and look for patterns: points outside the limits, runs of seven or more points on one side of the mean, or trends. If the chart shows only random variation within the limits, the process is in statistical control and capability indices can be computed. If not, the special cause must be found before proceeding.
Why This Foundation Matters
Every subsequent technique in this course — X-bar and R charts, p-charts, Cp/Cpk, Gage R&R, acceptance sampling — rests on the distinctions introduced here. Confusing specification limits with control limits leads to over-adjustment (tampering) or to ignoring real signals. Treating all variation as common cause leads to blaming operators for system problems. Treating all variation as special cause leads to endless firefighting. The disciplined separation of these concepts is what makes SQC a science rather than a collection of charts.
In the chapters that follow, you will learn to construct specific control charts, interpret their signals using established rules, quantify process capability, and integrate these tools into a functioning quality system. Each of those skills depends on the vocabulary and logic established in this chapter: quality characteristics define what to measure, variability defines what to expect, specification limits define what is acceptable, control limits define what is stable, and the SQC feedback loop defines how measurement becomes improvement.