1. Foundations of engineering test failure
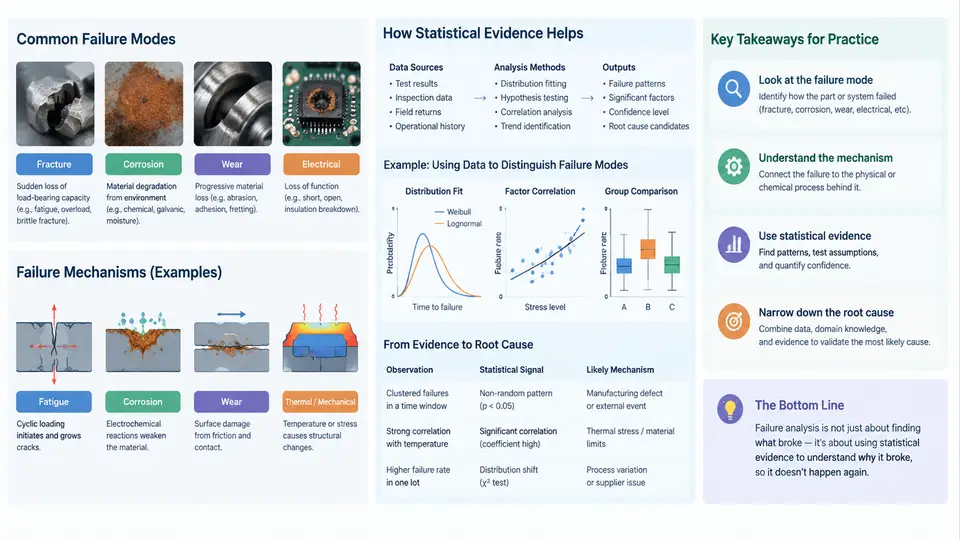
An engineering test failure is rarely a single event with a single cause. When a component cracks during a vibration qualification test, when a solder joint opens after 500 thermal cycles, or when a power module fails at 80% of its rated voltage, the observable event is the endpoint of a chain of physical processes that began long before the test started. Failure investigation is the disciplined reconstruction of that chain. Its purpose is not merely to explain what broke, but to establish, with defensible evidence, why it broke and what should change.
Three concepts form the backbone of this discipline: failure mode, failure mechanism, and root cause. Confusing them is one of the most common and costly mistakes in test engineering, because each demands a different kind of evidence and leads to a different corrective action.
Failure Mode, Mechanism, and Root Cause
A failure mode is the observable manner in which a product ceases to perform its required function. It is descriptive and phenomenological: fracture, short circuit, open circuit, leakage, delamination, seizure, drift out of tolerance. A failure mode can be seen, measured, or photographed. It answers the question what happened.
A failure mechanism is the physical, chemical, or electrical process that produced the mode. Fatigue crack propagation, electromigration, galvanic corrosion, dielectric breakdown, creep rupture, and dendritic growth are mechanisms. A mechanism answers how it happened and is governed by identifiable driving variables — stress amplitude, temperature, current density, humidity, time.
The root cause is the underlying condition or decision that allowed the mechanism to operate at a damaging level. It answers why it happened. Root causes typically fall into design (insufficient fatigue margin), manufacturing (voids in a die-attach layer), application (unexpected transient overvoltage), or test-program (wrong acceleration factor, incorrect boundary condition).
Note the direction of inference. Investigators observe the mode first, infer the mechanism from fracture-surface features and environmental history, and only then reason back to the root cause. Attempting to jump directly from mode to root cause produces plausible-sounding but unverified conclusions, which is exactly the failure pattern that statistical evidence is meant to prevent.
Why Statistical Evidence Is Not Optional
Engineering tests are samples. A qualification test might involve 6, 12, or 30 units drawn from a production population of thousands. A single failure therefore carries two distinct pieces of information: it is a physical event with a mechanism, and it is a data point with a probability. Ignoring the second interpretation leads to two opposite errors — over-reacting to a single random outlier, or dismissing a genuine systematic defect as "one bad part."
Statistical evidence enters the investigation at four points:
- Failure rate estimation. With r failures in n units, the point estimate is r/n, but the confidence interval matters far more. Zero failures in 10 units does not demonstrate a low failure rate; the 95% upper confidence bound on the failure probability is approximately 26%.
- Distribution identification. Time-to-failure data reveal whether the mechanism is wear-out (increasing hazard, Weibull shape β > 1), random (constant hazard, β ≈ 1), or infant-mortality (decreasing hazard, β < 1). This directly constrains which mechanisms are plausible.
- Comparison of groups. Comparing failure counts across lots, suppliers, orientations, or stress levels separates systematic effects from noise.
- Model validation. Acceleration factors and life models are only credible if the observed data are consistent with the assumed distribution and stress-life relationship.
The following diagram shows how physical evidence and statistical evidence converge on a defensible root cause. Neither path alone is sufficient: physical analysis without statistics cannot distinguish a systematic defect from chance, and statistics without physical analysis cannot identify a corrective action.
Applying the Framework: A Thermal Cycling Example
Consider a 12-unit thermal cycling test on a surface-mount power module, cycling between −40 °C and +125 °C with a 10-minute dwell. After 800 cycles, 3 of 12 units show an open circuit at a specific gate pin. The remaining 9 units pass 1500 cycles.
Mode: open circuit at the gate pin. Initial statistical reading: 3/12 = 25% failure by 800 cycles, while 9/12 survive to 1500 — a strongly bimodal outcome that is inconsistent with a single wear-out distribution. This alone suggests two populations or a threshold effect.
Cross-sectioning the failed units reveals cracked solder joints with crack paths along the package-side intermetallic layer. The 9 survivors, when cross-sectioned at end of test, show only minor voiding. Measuring the intermetallic compound (IMC) thickness gives 6–8 µm on failed units versus 2–3 µm on survivors. The mechanism is therefore IMC embrittlement driven by excessive reflow time, and the root cause is a soldering process excursion on one production lot.
The statistical evidence did not merely confirm the physical finding — it directed the investigation. The bimodal failure pattern told the engineer to look for a lot-to-lot difference rather than a design margin problem, which is where the IMC thickness comparison became meaningful. Had the failures been spread evenly across cycles, the investigation would have turned toward fatigue life modeling instead.
Evidence Quality and Common Pitfalls
Not all evidence carries equal weight. In descending order of reliability: physical failure analysis of the actual failed unit, controlled re-test reproducing the failure, measurement data from the test itself, production and process records, and finally recollection or assumption. Investigations that rest primarily on the last category are the ones that recur.
Three pitfalls deserve explicit attention:
- Confirmation bias. Once a plausible mechanism is named, subsequent analysis tends to seek supporting evidence. Mitigate by stating, in advance, what observation would falsify the hypothesis.
- Sample-size neglect. A corrective action validated on 3 units proves very little. Define the required sample size from the target reliability and confidence level before the verification test.
- Confusing correlation with causation in field data. A failure rate that rises with ambient temperature may reflect temperature itself, or may reflect that hot locations also vibrate more. Only controlled testing separates the two.
What a Complete Investigation Delivers
A defensible investigation closes with four linked statements: the failure mode as observed, the mechanism with its supporting physical evidence, the root cause with its statistical support, and the corrective action with a verification plan. Each statement should be traceable to specific data — a micrograph, a cycle count, a confidence interval, a process record. When any link is missing, the conclusion should be labeled as a hypothesis rather than a finding, and the investigation is not yet complete.
This chapter establishes the vocabulary and the evidentiary standard used throughout the rest of the course. Subsequent chapters apply these foundations to specific test types, data analysis methods, and corrective-action workflows.