1. Industrial process monitoring landscape
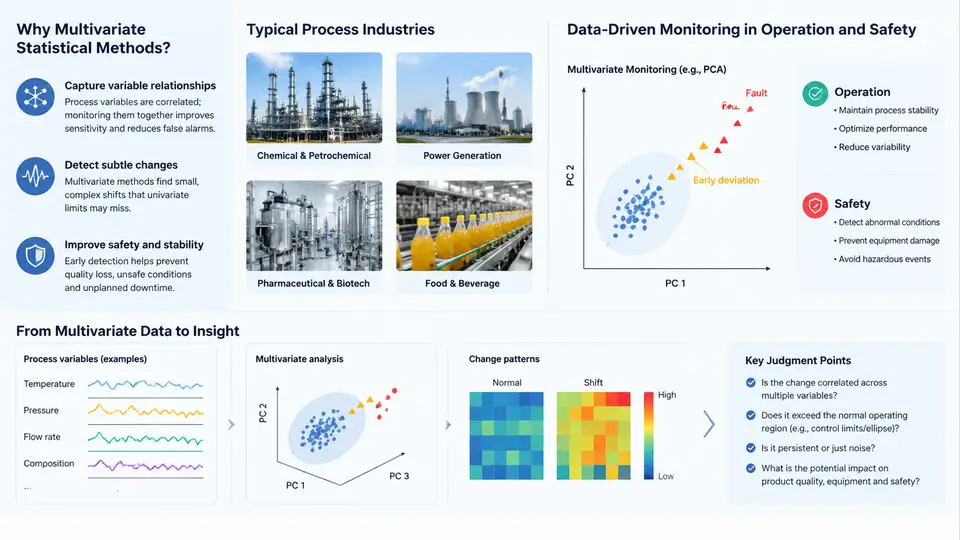
Modern process industries operate plants that convert raw materials into products through tightly coupled networks of reactors, columns, compressors, heat exchangers, and utilities. A single large refinery or petrochemical complex may contain thousands of measured variables sampled every second, and the economic and safety consequences of an undetected abnormality can be enormous. Process monitoring is the discipline that keeps these plants observable: it detects when operation drifts away from its intended envelope, diagnoses which unit or loop is responsible, and supports operators in returning the process to a safe, profitable state. This chapter explains why multivariate statistical methods have become a cornerstone of that discipline, which industries rely on them most, and how data-driven monitoring fits into the broader operation and safety framework.
Why Univariate Monitoring Is Not Enough
Traditional control-room monitoring relies heavily on univariate limits: a temperature high alarm, a pressure low alarm, a flow deviation alarm. Each variable is judged against its own threshold, independently of the others. This works acceptably when variables are loosely coupled, but industrial processes are inherently multivariate. Consider a simple example from a distillation column: feed flow, reboiler steam flow, reflux flow, column pressure, and tray temperatures are strongly correlated through material and energy balances. Under normal operation, a modest increase in feed flow is accompanied by a proportional increase in reboiler duty and reflux, and tray temperatures shift slightly but coherently.
Two failure modes of univariate monitoring follow directly from this coupling. First, false alarms: a variable may exceed its individual limit simply because a correlated variable changed, even though the overall process state remains normal. Operators who receive many such alarms begin to distrust the system. Second, and more dangerous, missed detections: a fault can develop along a direction in which every individual variable stays within its own limits, yet the combination of values is abnormal. A slow heat-exchanger fouling, a gradual catalyst deactivation, or a sensor drift often manifests exactly this way. Multivariate statistical methods address both problems by modeling the joint behavior of many variables simultaneously, so that the correlation structure itself becomes the reference against which new data are judged.
Typical Process Industries and Their Monitoring Needs
Multivariate statistical monitoring (MSPM) is most valuable in continuous and semi-continuous process industries where large historical datasets of normal operation exist and where variables are strongly correlated. Representative sectors include:
- Petroleum refining and petrochemicals: crude units, fluid catalytic cracking, hydrocracking, ethylene crackers. Hundreds of temperatures, pressures, and flows are tightly coupled; abnormal situations can escalate to safety incidents within minutes.
- Chemical manufacturing: reactors, distillation trains, polymerization units. Batch and grade transitions make multivariate trajectory monitoring especially relevant.
- Pharmaceutical and bioprocessing: fermentation, cell culture, and API synthesis, where process analytical technology (PAT) initiatives explicitly call for multivariate monitoring of critical process parameters.
- Pulp and paper, cement, and steel: large material and energy flows with slow dynamics and significant sensor redundancy.
- Power generation: boilers, turbines, and combined-cycle plants, where efficiency and emissions depend on many correlated operating variables.
- Water and wastewater treatment: biological processes with strong seasonal and load-driven variability.
These industries share three characteristics that make data-driven monitoring attractive: abundant historical data from distributed control systems (DCS) and historians, strong inter-variable correlation, and high cost of unplanned downtime or safety events.
The Role of Data-Driven Monitoring in Operation and Safety
Data-driven monitoring does not replace first-principles models or the basic control system; it complements them. Its role can be understood across three layers of plant operation:
- Regulatory control layer: PID and advanced controllers keep individual loops at setpoint. MSPM sits above this layer, watching whether the overall operating point remains consistent with normal behavior.
- Supervisory and optimization layer: real-time optimization and advanced process control (APC) push the plant toward economic targets. MSPM provides an independent check that these targets are being pursued within a safe, statistically normal region.
- Safety and alarm management layer: safety instrumented systems (SIS) handle hard trips, while MSPM provides early warning of developing abnormalities, giving operators time to intervene before a trip or incident.
In practice, a multivariate monitoring system computes statistics such as the Hotelling T2 and squared prediction error (SPE, also called Q statistic) from a principal component analysis (PCA) model built on normal operating data. The T2 statistic measures variation within the principal component subspace, while SPE measures residual variation outside it. When either statistic exceeds its control limit, an abnormality is flagged; contribution plots then identify which variables are responsible. This workflow—model, monitor, detect, diagnose—is the backbone of the course.
A Minimal Worked Example
To make the workflow concrete, consider a simplified example with three variables from a reactor: feed flow F (kg/h), reactor temperature T (°C), and coolant flow C (kg/h). Suppose 500 samples of normal operation are available. After mean-centering and scaling each variable to unit variance, a PCA model is built. The first two principal components explain 92% of the variance; the third component captures mostly noise.
For a new sample, the monitoring system computes T2 and SPE. Suppose the 99% control limits are T2lim = 9.21 and SPElim = 6.63. A new sample yields T2 = 4.1 and SPE = 14.8. The T2 value is well within limits, but SPE exceeds its limit, indicating that the sample lies outside the normal correlation structure. A contribution plot shows that C contributes most to the SPE. The operator investigates the coolant loop and finds a partially closed valve. This is a textbook illustration of how multivariate monitoring detects a fault that univariate limits would miss: each variable individually may still be within its own range, but their combination is abnormal.
What This Course Covers
The remaining chapters build from this foundation. You will learn how to prepare industrial data for multivariate analysis, how PCA and partial least squares (PLS) models are constructed and validated, how T2 and SPE control limits are derived, how contribution plots and other diagnosis tools localize faults, and how to handle dynamic, batch, and nonlinear processes. Later chapters address practical deployment issues: model maintenance, false-alarm reduction, integration with DCS and alarm systems, and case studies from refining, chemicals, and pharmaceuticals. By the end, you should be able to design, implement, and troubleshoot a multivariate statistical monitoring system for a realistic industrial process.
The central message of this chapter is that industrial process monitoring is fundamentally a multivariate problem, and data-driven statistical methods provide a practical, scalable way to detect and diagnose abnormalities that univariate alarms cannot catch. The next chapter begins the technical journey by examining the characteristics of industrial data and the preprocessing steps required before any multivariate model can be trusted.