1. Industrial data science landscape
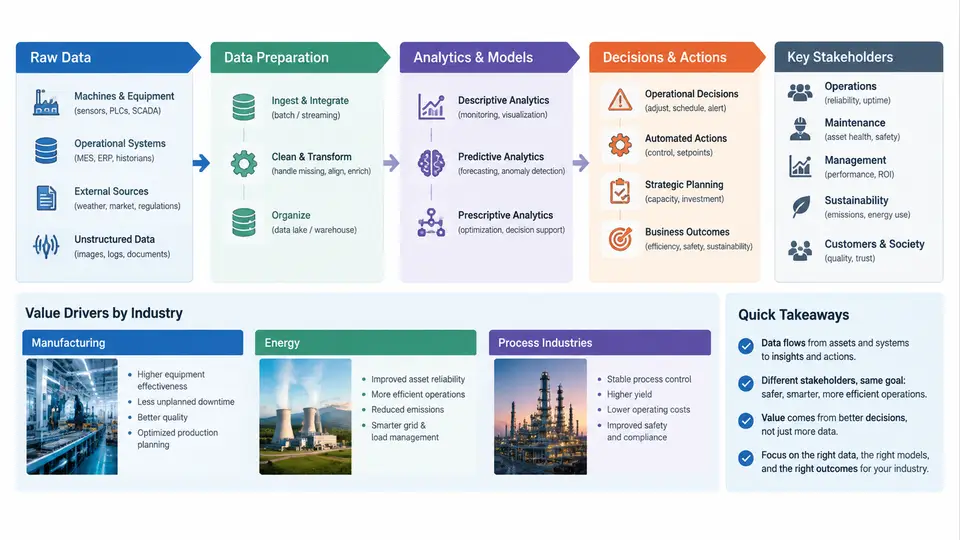
Industrial data science is not a rebranded version of business analytics. In manufacturing, energy, and process industries, the data is generated by physical assets governed by thermodynamics, chemistry, and mechanical dynamics. A pump vibration signal, a distillation column temperature profile, or a wind turbine SCADA stream is not a customer click — it is a measurement of a physical state that can be traced back to equipment health, product quality, or safety margins. The purpose of industrial data science is to convert these measurements into decisions that reduce unplanned downtime, cut energy consumption, improve yield, or prevent hazardous events.
This chapter defines the raw-data-to-decisions pipeline, identifies the stakeholders who consume each stage, and explains where value is actually created across the three major industrial domains.
Defining the Raw Data to Decisions Pipeline
The pipeline is best understood as five connected layers, each with distinct data characteristics and failure modes. The diagram below shows the flow and the key transformation at each stage.
Each layer has a distinct owner and a distinct failure mode. Acquisition fails when a sensor drifts or a historian tag is misconfigured. Engineering fails when timestamps are not aligned across systems — a common problem when the DCS clock and the LIMS clock differ by minutes. Analytics fails when a model is trained on data that does not represent the current operating regime. Decision support fails when an operator receives 200 alarms per hour and ignores all of them. Action fails when there is no feedback loop to confirm whether the decision actually improved the outcome.
Key Stakeholders and Their Decision Horizons
Industrial data science serves four primary stakeholder groups, each with a different time horizon and a different tolerance for uncertainty.
| Stakeholder | Primary Question | Decision Horizon | Typical Data Product |
|---|---|---|---|
| Control room operator | Is the process safe and within limits right now? | Seconds to minutes | Real-time trend, alarm priority, advisory setpoint |
| Process / production engineer | How do I improve yield or reduce variability this week? | Hours to days | Soft sensor, batch comparison, SPC chart |
| Maintenance & reliability engineer | Which asset will fail next, and when? | Days to weeks | Remaining useful life estimate, anomaly score |
| Plant / operations manager | Where should I invest to maximize margin? | Weeks to quarters | KPI dashboard, energy baseline, OEE breakdown |
A critical design principle follows from this table: the same raw data must be served at different latencies and granularities to different stakeholders. A vibration waveform sampled at 25.6 kHz for bearing fault detection is not the same data product as a monthly vibration trend for a reliability review. The pipeline must support both without forcing one to degrade the other.
Value Drivers Across Manufacturing, Energy, and Process Industries
Although the pipeline is generic, the value drivers differ by domain.
Manufacturing (discrete and hybrid). The dominant value drivers are OEE improvement, scrap reduction, and throughput increase. A typical example: a CNC machining line generates spindle load, feed rate, and acoustic emission data. An anomaly detection model trained on normal cutting conditions can flag tool wear 15–20 minutes before surface finish degrades, allowing a tool change during a planned pause rather than a scrap event. The value is measured in avoided scrap cost and recovered capacity.
Energy (power generation and renewables). Value comes from availability, heat rate, and dispatch optimization. For a combined-cycle gas turbine, a 1% improvement in heat rate translates to millions of dollars annually. Data science contributes through combustion dynamics monitoring, compressor fouling detection, and wind turbine power curve optimization. The key constraint is that energy assets often have strict regulatory and grid-code requirements, so models must be explainable and auditable.
Process industries (chemicals, refining, pharmaceuticals). Value is driven by yield, energy intensity, and safety. A refinery crude unit can benefit from a soft sensor that predicts product quality (e.g., naphtha endpoint) from tray temperatures and reflux ratios, reducing the need for lab samples from every 4 hours to every 12 hours. In pharmaceuticals, the value driver is often batch consistency and regulatory compliance — a multivariate model that predicts batch failure at hour 6 of a 48-hour fermentation can save the entire batch cost.
Inputs: tray temperatures T1–T8 (°C), reflux flow (m³/h), feed flow (m³/h), column pressure (bar).
Target: overhead product composition (% light key).
Model: partial least squares (PLS) with 3 latent components, trained on 6 months of hourly averages.
Validation: RMSE = 0.42% composition, R² = 0.91 on a held-out 4-week period.
Operational rule: if the soft sensor prediction deviates from the lab sample by more than 1.5%, trigger a model review.
These values are illustrative and must be re-estimated for any real column.
What Makes Industrial Data Science Different
Three characteristics separate industrial data science from general data science practice.
1. Physics constrains the solution space. A model that predicts negative flow or a temperature above the adiabatic flame limit is not just inaccurate — it is dangerous. Industrial models must respect mass and energy balances, equipment ratings, and safety interlocks. This often means hybrid models that combine first-principles equations with data-driven residuals.
2. Data is often scarce, imbalanced, and non-stationary. Failures are rare by design — a well-maintained plant may have only two compressor trips per year. Training a classifier on 730 daily records with two positive labels is not a standard machine learning problem. Techniques such as anomaly detection, survival analysis, and transfer learning from similar assets are more appropriate than supervised classification.
3. The decision loop includes a human and a physical actuator. A recommendation that cannot be executed by an operator, or that conflicts with a safety procedure, has zero value. The pipeline must therefore include human factors engineering: alarm prioritization, explainable model outputs, and clear escalation paths.
Common Failure Modes and How to Avoid Them
Most industrial data science projects fail for non-technical reasons. The table below summarizes the most frequent failure modes and their mitigations.
| Failure Mode | Symptom | Mitigation |
|---|---|---|
| No decision owner | Model accuracy is high but nobody uses it | Identify the decision owner before model development |
| Data quality neglect | Model performs well in training, fails in production | Implement data quality scoring and drift monitoring from day one |
| Over-automation | Operators distrust and bypass the system | Start with advisory mode; automate only after trust is established |
| Ignoring operating regimes | Model fails during startup, shutdown, or grade changes | Segment data by regime; build separate models or include regime as a feature |
| No feedback loop | Cannot prove value; model degrades silently | Log every decision outcome and retrain on a defined schedule |
The raw-data-to-decisions pipeline is the organizing framework for the rest of this course. Every subsequent chapter addresses one or more layers: data acquisition and quality, feature engineering, model selection, deployment, and value measurement. The industrial context — physics, safety, and human operators — is not a constraint to be worked around; it is the source of the problem’s difficulty and the reason the solutions are valuable.