1. Foundations of engineering root cause an
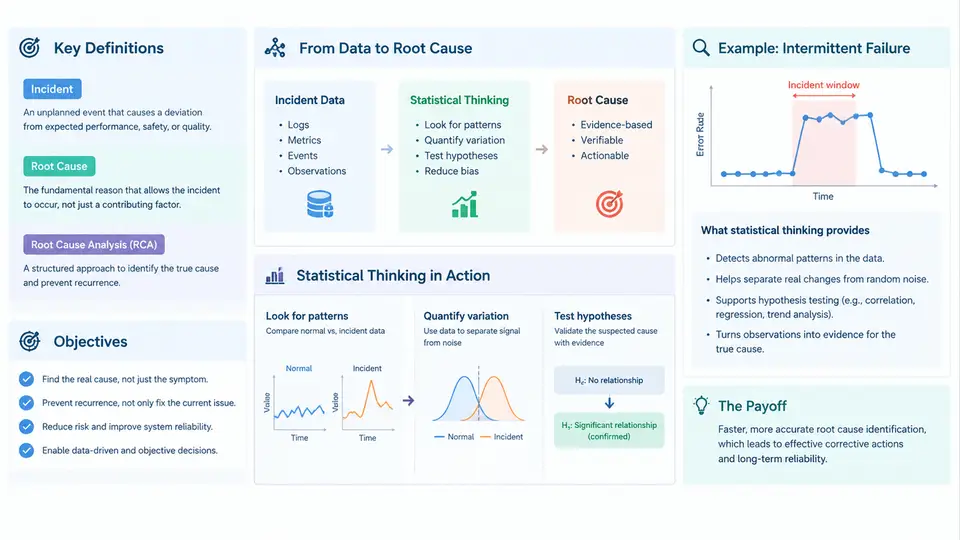
When a production line halts, a pressure vessel cracks, or a batch of PCBs fails final test, the immediate question is always "what happened?" The more valuable question is "why did it happen, and will it happen again?" Engineering root cause analysis (RCA) is the disciplined practice of answering that second question. It is not a meeting, a blame exercise, or a form to fill in after an incident. It is a structured investigation that moves from an observed failure event to the underlying causal mechanism, and then to a corrective action that prevents recurrence.
What Root Cause Analysis Actually Means
A root cause is the most fundamental cause in a causal chain that, if corrected, prevents the problem from recurring. This definition carries two important constraints. First, "most fundamental" is relative to what you can control: a bearing failure caused by inadequate lubrication is not resolved by blaming the lubricant supplier if the real cause is a maintenance schedule that was never updated after a design change. Second, "prevents recurrence" is the test of whether you have gone deep enough. If your corrective action only addresses the symptom, the failure will return.
It helps to distinguish three layers of causation commonly seen in engineering incidents:
- Physical cause — the immediate mechanism, e.g., fatigue crack initiation at a weld toe due to cyclic stress concentration.
- Human or procedural cause — the action or omission that allowed the physical cause, e.g., weld inspection skipped due to a scheduling conflict.
- Systemic or latent cause — the organizational or design condition that made the human cause likely, e.g., inspection intervals defined without fatigue life analysis.
Effective RCA reaches the systemic layer. Stopping at the physical cause produces a repair; reaching the systemic cause produces a fix.
Objectives of an Engineering RCA
An RCA is successful when it delivers four things: a verified causal chain, a corrective action that addresses the root cause, evidence that the action works, and knowledge that transfers to similar systems. The last point is often neglected. A root cause found in one pump seal failure may apply to twelve identical pumps elsewhere in the plant. RCA is therefore both a reactive and a proactive tool.
It is equally important to state what RCA is not. It is not a fault tree drawn after the answer is already known, and it is not a search for the person who made the mistake. Investigations that begin with a name rather than a mechanism reliably produce incomplete causal chains.
Why Statistical Thinking Belongs in the Investigation
Engineering failures rarely announce their cause. They appear as variation: a dimension drifts, a temperature spikes, a failure rate changes. Statistical thinking provides the tools to separate signal from noise, to quantify how confident you can be in a causal claim, and to decide whether an observed pattern is real or coincidental.
Three statistical concepts are foundational to RCA:
- Variation and distribution — every process has natural variation. A single out-of-spec measurement may be routine variation or the first sign of a shift. Control charts and distribution fitting help distinguish the two.
- Correlation versus causation — two variables moving together does not prove one causes the other. RCA must identify the mechanism, not just the association.
- Sampling and inference — you almost never inspect every unit. Conclusions drawn from a sample carry uncertainty, and that uncertainty must be stated.
Consider a concrete example. A CNC machining line produces shafts with a nominal diameter of 25.00 mm and a tolerance of ±0.05 mm. Over three shifts, 200 shafts are measured. The mean is 25.01 mm and the standard deviation is 0.018 mm. A control chart shows the last 30 parts trending upward by 0.008 mm. Individually, every part is within tolerance. Statistically, the trend is a signal: the process mean is shifting. An RCA that only checks "is the part in spec?" would miss it. An RCA that applies statistical thinking asks "is the process stable?" and finds the answer is no — perhaps a tool wear compensation offset was not updated, or coolant temperature rose. The statistical signal directs the physical investigation.
The RCA Investigation Flow
The diagram below shows how an engineering RCA moves from event detection through causal analysis to verified corrective action, with statistical methods supporting each stage. Note that the flow is iterative: if verification fails, the investigation returns to causal analysis rather than jumping to a new corrective action.
Applying the Framework: A Worked Example
To make the framework concrete, consider a real-world style scenario. A hydraulic press used in metal forming begins producing parts with dimensional variation exceeding tolerance after approximately 4,000 cycles. The maintenance team replaces the hydraulic fluid and the problem disappears for 1,500 cycles, then returns.
Step 1 — Define the event precisely. The failure is not "the press is broken." It is "dimensional variation of formed parts exceeds ±0.15 mm after a mean of 4,200 cycles (n=6 events)."
Step 2 — Collect data. Record cycle count, fluid temperature, fluid pressure, and part dimension for each production run. A sample of 50 consecutive parts is measured at the start, middle, and end of each run.
Step 3 — Statistical screening. Plot dimension against cycle count. A regression shows a slope of +0.00004 mm per cycle with R² = 0.87. The relationship is strong and monotonic. A control chart on fluid temperature shows an upward shift beginning around cycle 3,500.
Step 4 — Causal analysis. The physical cause is thermal expansion of the hydraulic cylinder affecting stroke length. The systemic cause is a cooling circuit designed for 3,000-cycle duty, never updated when the press was modified for higher throughput. The 5-Why chain reaches the design change control process.
Step 5 — Corrective action. Upgrade the cooling circuit capacity and add a temperature interlock. The action addresses the systemic cause, not just the symptom.
Step 6 — Verification. Run 10,000 cycles with the new cooling circuit. Dimension variation remains within ±0.08 mm. A two-sample t-test comparing before and after variation yields p < 0.01, confirming the improvement is statistically significant.
Common Pitfalls in Early RCA Practice
Three mistakes appear repeatedly when teams first adopt statistical RCA:
- Confusing common and special cause variation. Reacting to every data point as if it were a signal leads to over-adjustment, which actually increases variation. Control charts exist precisely to prevent this.
- Stopping at the first plausible cause. The first explanation that fits the data is not necessarily the root cause. Test alternative hypotheses before committing to a corrective action.
- Ignoring sample size. A conclusion drawn from three parts is not the same as one drawn from three hundred. State your confidence level and interval estimates.
Statistical thinking does not make RCA complicated. It makes it honest. It forces the investigator to distinguish what the data actually shows from what the team expects to see, and it provides the quantitative basis for deciding when an investigation is complete. The chapters that follow build on this foundation, moving from definitions and objectives into the specific tools and techniques that make engineering RCA rigorous and repeatable.