1. Engineering analytics platform overview
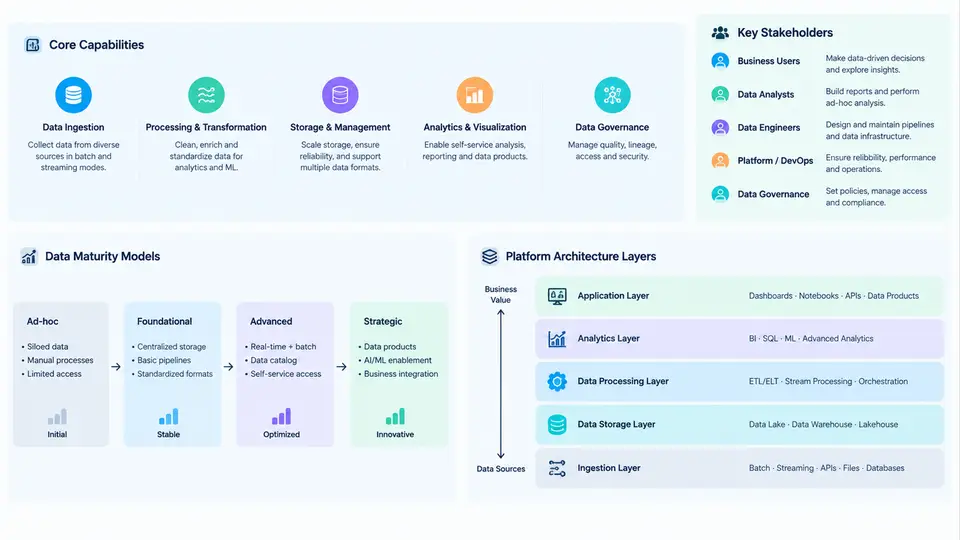
An engineering analytics platform is the shared system of record and computation that turns raw operational, product, and infrastructure telemetry into decisions engineers can act on. It is not a single tool but a layered capability stack: ingestion, storage, transformation, semantic modeling, serving, and governance. The goal is to make trustworthy metrics and exploratory data available to many teams without each team rebuilding its own pipeline. This chapter establishes the vocabulary, the stakeholders, the maturity progression, and the architectural layers that every later chapter builds on.
Core Capabilities
A mature platform delivers six capabilities that reinforce one another:
- Ingestion and transport — batch and streaming collection from CI/CD systems, application logs, metrics agents, and event buses, with schema validation and dead-letter handling.
- Storage and retention — a lake or lakehouse for raw and curated data, plus time-series and OLAP stores for high-concurrency analytical queries.
- Transformation and orchestration — scheduled and event-driven jobs that clean, join, and aggregate data, with dependency management and backfill support.
- Semantic layer — governed metric definitions, dimensions, and joins so that "deployment frequency" means the same thing in every dashboard.
- Serving and exploration — BI dashboards, notebooks, APIs, and alerting that expose data to both analysts and automated systems.
- Governance and observability — lineage, access control, data quality checks, freshness monitoring, and cost attribution.
These capabilities are interdependent. A semantic layer without reliable ingestion produces confidently wrong numbers; governance without observability cannot detect silent data loss. Platform design is therefore about balancing these concerns rather than maximizing any single one.
Stakeholders and Their Needs
Different stakeholders consume the platform at different abstraction levels, and their requirements often conflict. Making those conflicts explicit early prevents rework.
| Stakeholder | Primary need | Typical interface | Key concern |
|---|---|---|---|
| Software engineers | Build and deployment health, error rates | Dashboards, CI annotations | Low-latency, low-friction instrumentation |
| Data analysts | Ad-hoc exploration, cohort and trend analysis | SQL, notebooks, BI tools | Freshness and query performance |
| Data engineers | Pipeline reliability, schema evolution | Orchestrators, code repos | Idempotency, backfill cost |
| Product managers | Adoption, retention, feature impact | Curated dashboards | Metric consistency across teams |
| SRE / operations | SLO tracking, incident response | Alerting, runbooks | Signal-to-noise ratio, alert latency |
| Security & compliance | Access control, audit trails, PII handling | Policy engines, catalogs | Least privilege, retention limits |
A common failure mode is optimizing for one stakeholder — usually analysts — while ignoring the instrumentation burden on engineers. If emitting an event requires a multi-day change, data quality degrades at the source and no downstream governance can recover it.
Data Maturity Models
Maturity models help teams locate themselves and choose the next investment. A practical four-stage progression for engineering analytics is:
- Ad hoc (Stage 1) — data lives in individual tools; metrics are computed manually or in spreadsheets. No shared definitions. Questions are answered case by case.
- Centralized (Stage 2) — a warehouse or lake exists, ingestion is automated, and a small team owns pipelines. Dashboards are shared but definitions still drift.
- Governed (Stage 3) — a semantic layer defines metrics centrally, data quality checks run in pipelines, lineage is tracked, and access is role-based. Self-service is safe.
- Adaptive (Stage 4) — metrics feed automated decisions: deployment gates, anomaly detection, capacity planning. The platform supports experimentation and closed-loop feedback.
Progression is not strictly linear, and teams may be at different stages for different domains. The useful question is not "what stage are we?" but "what is the next bottleneck?" — usually definition consistency at Stage 2 and trust/observability at Stage 3.
Platform Architecture Layers
The architecture can be understood as five horizontal layers with cross-cutting governance. Data flows upward from sources to consumers, while metadata and policy flow across all layers.
Each layer has a distinct contract. Ingestion guarantees delivery and schema conformance; storage guarantees durability and query performance; transformation guarantees correctness and idempotency; the semantic layer guarantees consistent definitions; serving guarantees availability and latency. Governance cuts across all five, providing lineage, access control, quality monitoring, and cost visibility.
A Concrete Walkthrough
Consider a team tracking deployment frequency. A CI/CD webhook emits a deployment.completed event with fields service, environment, commit_sha, and timestamp. The ingestion layer validates the schema and writes to a raw event table. A transformation job deduplicates by commit_sha and aggregates daily counts per service. The semantic layer defines deployment_frequency as the count of distinct successful deployments per service per day. A dashboard queries this metric, and an alert fires if the seven-day rolling average drops below a threshold.
If the dashboard shows zero deployments for a service that clearly shipped, the troubleshooting path follows the layers downward: check serving freshness, then semantic metric filters, then transformation job status, then raw event volume. This layered diagnosis is the practical payoff of a well-defined architecture.
With these foundations — capabilities, stakeholders, maturity stages, and layers — subsequent chapters can drill into ingestion patterns, storage selection, transformation design, semantic modeling, and governance implementation. The architecture described here is the reference model against which each of those decisions will be evaluated.