3. 设备健康指标构建与趋势可视化
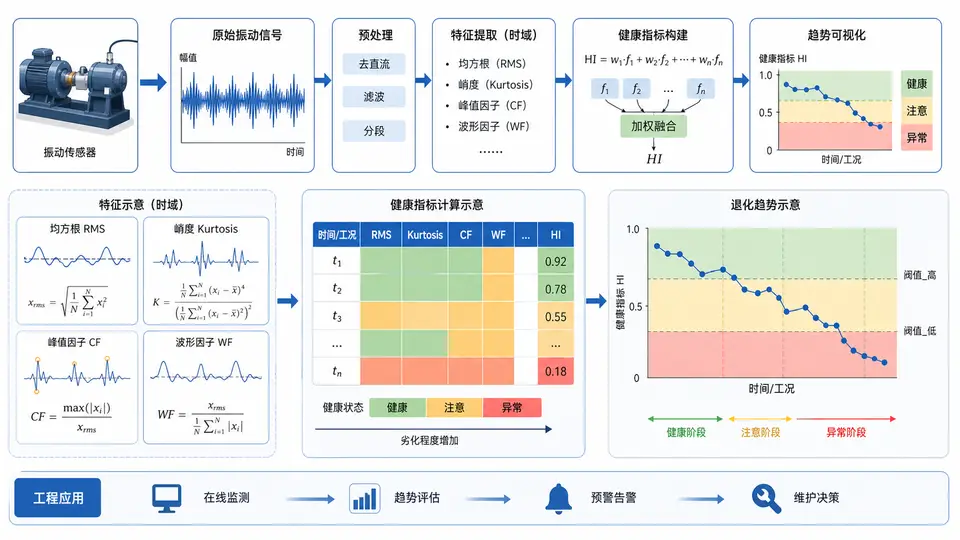
任务说明
从一段原始振动信号中提取时域特征(RMS、峭度、峰值因子),按时间窗滑动计算,合成一个归一化健康指标 HI,并绘制退化趋势图。环境:Python 3.9+,依赖 numpy、matplotlib。运行后输出特征表与趋势图,用于判断设备是否进入退化阶段。
实现思路
完整代码
import numpy as np
import matplotlib.pyplot as plt

# 1. 构造仿真振动信号:前段健康,后段幅值增大模拟退化
rng = np.random.default_rng(42)
fs, dur = 1000, 10                      # 采样率 1000Hz,10 秒
t = np.arange(0, dur, 1 / fs)
base = np.sin(2 * np.pi * 50 * t)       # 50Hz 主频
amp = np.linspace(1.0, 3.0, t.size)     # 幅值随时间增大
noise = rng.normal(0, 0.3, t.size)
x = amp * base + noise

# 2. 时域特征提取
def time_features(seg):
    rms = np.sqrt(np.mean(seg ** 2))
    peak = np.max(np.abs(seg))
    crest = peak / rms if rms > 0 else 0.0
    kurt = np.mean((seg - seg.mean()) ** 4) / (seg.std() ** 4 + 1e-12)
    return rms, kurt, crest

win, step = 256, 128                    # 窗口与步长
feats, centers = [], []
for start in range(0, t.size - win + 1, step):
    seg = x[start:start + win]
    feats.append(time_features(seg))
    centers.append(t[start + win // 2])
feats = np.array(feats)                 # 列: rms, kurt, crest
centers = np.array(centers)

# 3. 归一化并合成健康指标(RMS 与峭度加权,越大越退化)
def norm(v):
    return (v - v.min()) / (v.max() - v.min() + 1e-12)

hi = 0.6 * norm(feats[:, 0]) + 0.4 * norm(feats[:, 1])
hi = 1 - hi                             # 1=健康, 0=严重退化

# 4. 输出特征表与趋势图
print("time(s)   RMS    kurt   crest    HI")
for c, f, h in zip(centers, feats, hi):
    print(f"{c:6.2f}  {f[0]:6.3f} {f[1]:6.3f} {f[2]:6.3f}  {h:5.3f}")

plt.figure(figsize=(8, 4))
plt.plot(centers, hi, "o-", color="#6b46c1")
plt.axhline(0.5, color="red", ls="--", label="预警阈值 0.5")
plt.xlabel("Time (s)")
plt.ylabel("Health Index")
plt.title("Equipment Health Degradation Trend")
plt.legend()
plt.grid(alpha=0.3)
plt.tight_layout()
plt.savefig("health_trend.png", dpi=120)
print("saved: health_trend.png")
运行与验证
pip install numpy matplotlib
python health_trend.py
判定标准:终端打印出各时间窗的 RMS、峭度、峰值因子与 HI 值;HI 随幅值增大而单调下降,末段接近 0;生成 health_trend.png,曲线整体下行并在后段跌破 0.5 预警线。若 HI 无下降趋势或图像未生成,则检查窗口长度与归一化逻辑。